The content below represents the personal views and opinions of the authors. It should not be considered as investment or financial advice.
📚 News Of The Week 🎓
Written by @CryptoinsightUK - X/Twitter
The Bulls are Back in Town: $BTC Outlook
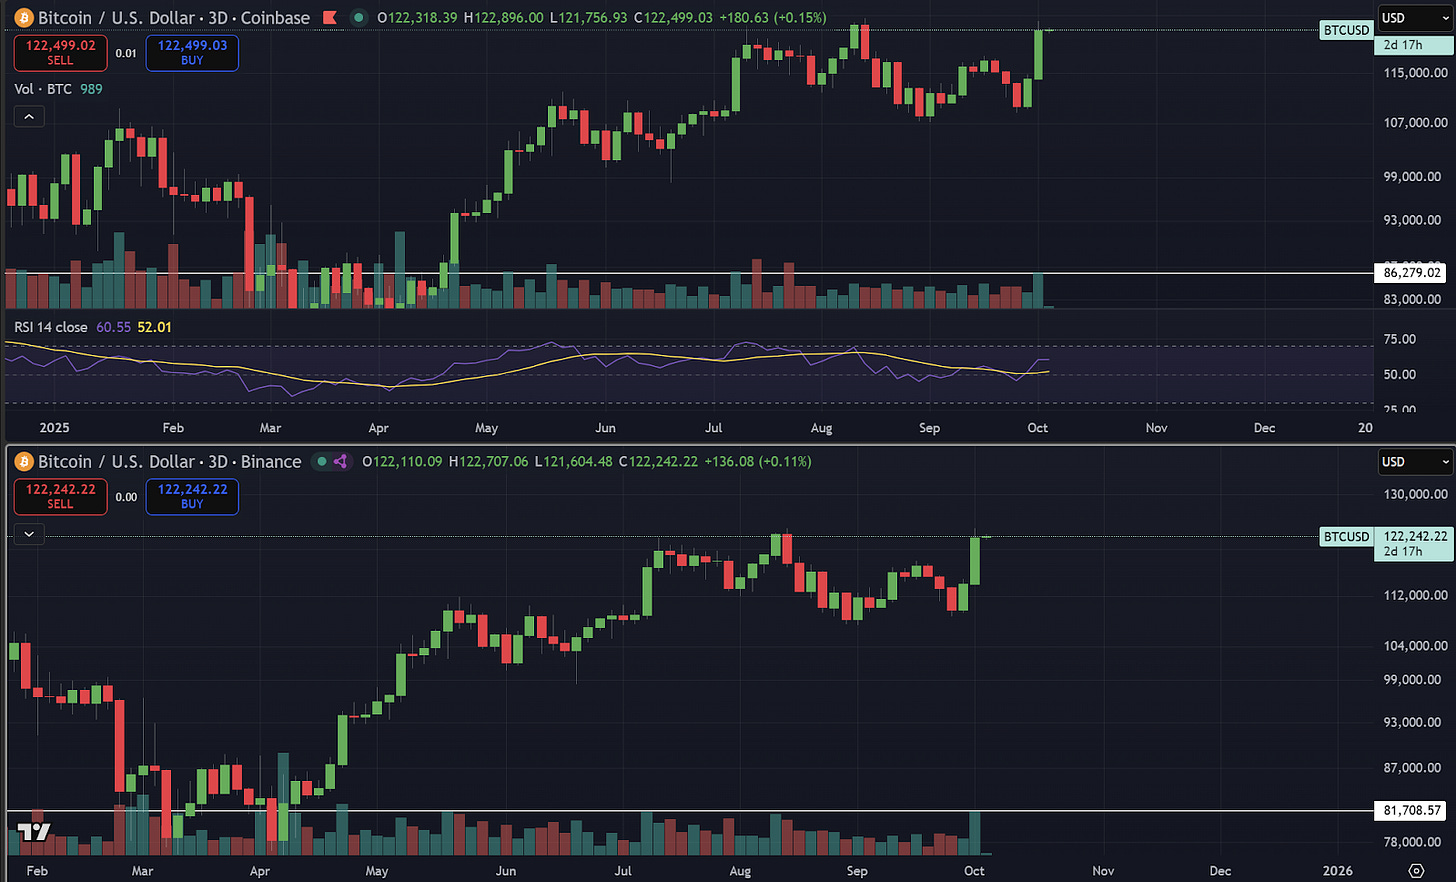
The first thing I want to discuss is the three day close on Bitcoin. The chart above shows data from the two largest exchanges, Binance and Coinbase, focusing on the three day close. What I really want to highlight is the volume. During this most recent push over the last three days, we have seen significantly higher volume than at any point in recent months. On Binance, it is the highest since May, and on Coinbase, it is the highest since the middle of August. This is a strong sign that the bulls are starting to take control of the market once again.
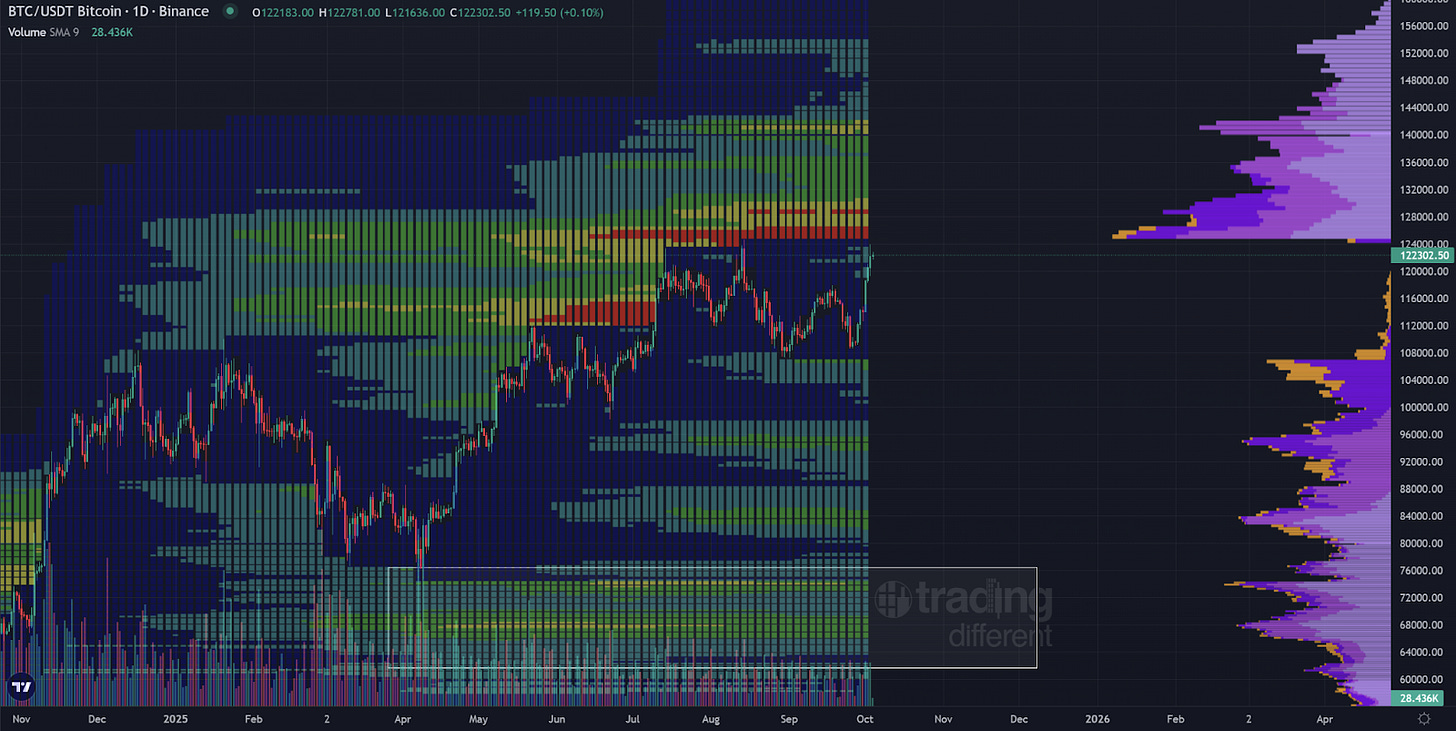
Next, if we look at liquidity, we can see that the densest liquidity sits above us, reaching up to around 132 thousand, with additional liquidity building near 144 thousand and extending up to 152 thousand. This is for Bitcoin, of course. Another important note is that liquidity below us is being removed, which suggests that people closing their long positions below are likely taking profits. This also means there is now less drag or pull to the downside, which supports the potential for further upward movement.
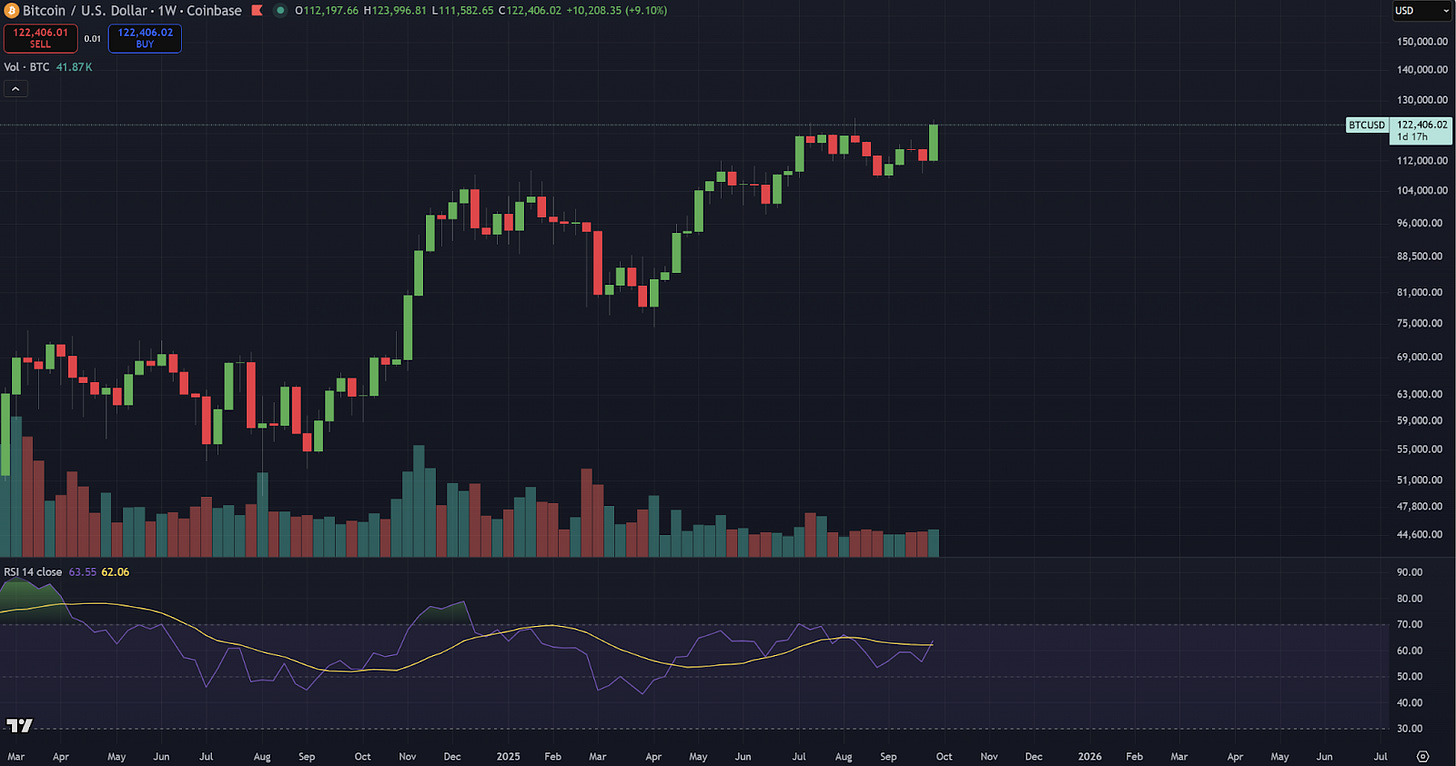
My final technical note about Bitcoin on the weekly time frame is that if we can close here or higher, it will mark a new all-time high for Bitcoin on the weekly chart. We will also see an uptick in volume and a bullish cross forming on the weekly RSI. Overall, things are looking very strong for an explosive move ahead if we can secure this weekly close or see continuation into tomorrow.
I’m going to spend the rest of this week’s newsletter focusing on XRP specifically, as it makes up a significant part of my portfolio. Before we dive into that, I want to encourage you all to check out my recent posts about the RTY, or the Russell 2000. This index is often used as an indicator of market breadth, and I believe it’s currently mirroring the 2020 cycle. We’ve just seen the highest weekly close for the RTY this week, which could signal that capital may soon begin rotating into altcoins as well.
https://x.com/Cryptoinsightuk/status/1974364483817705679
$XRP Deep Dive
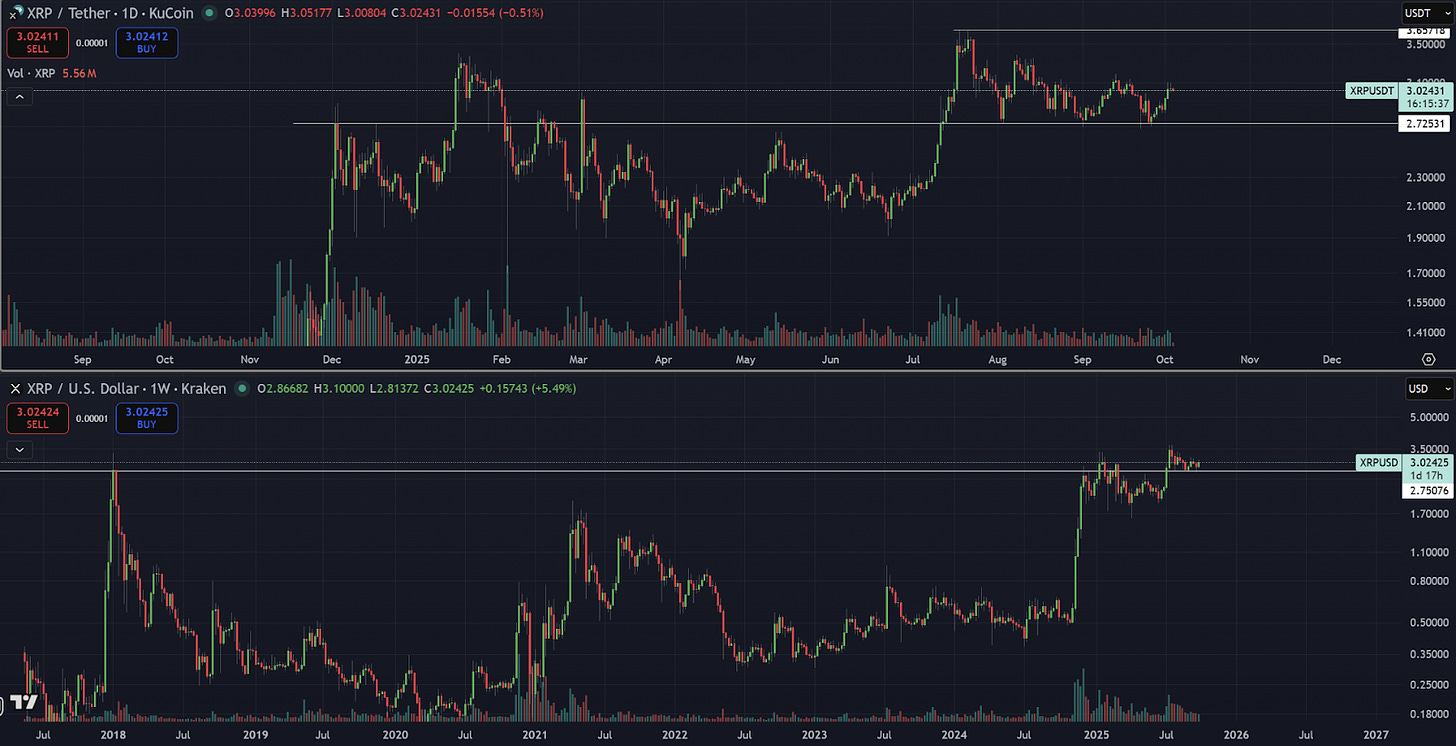
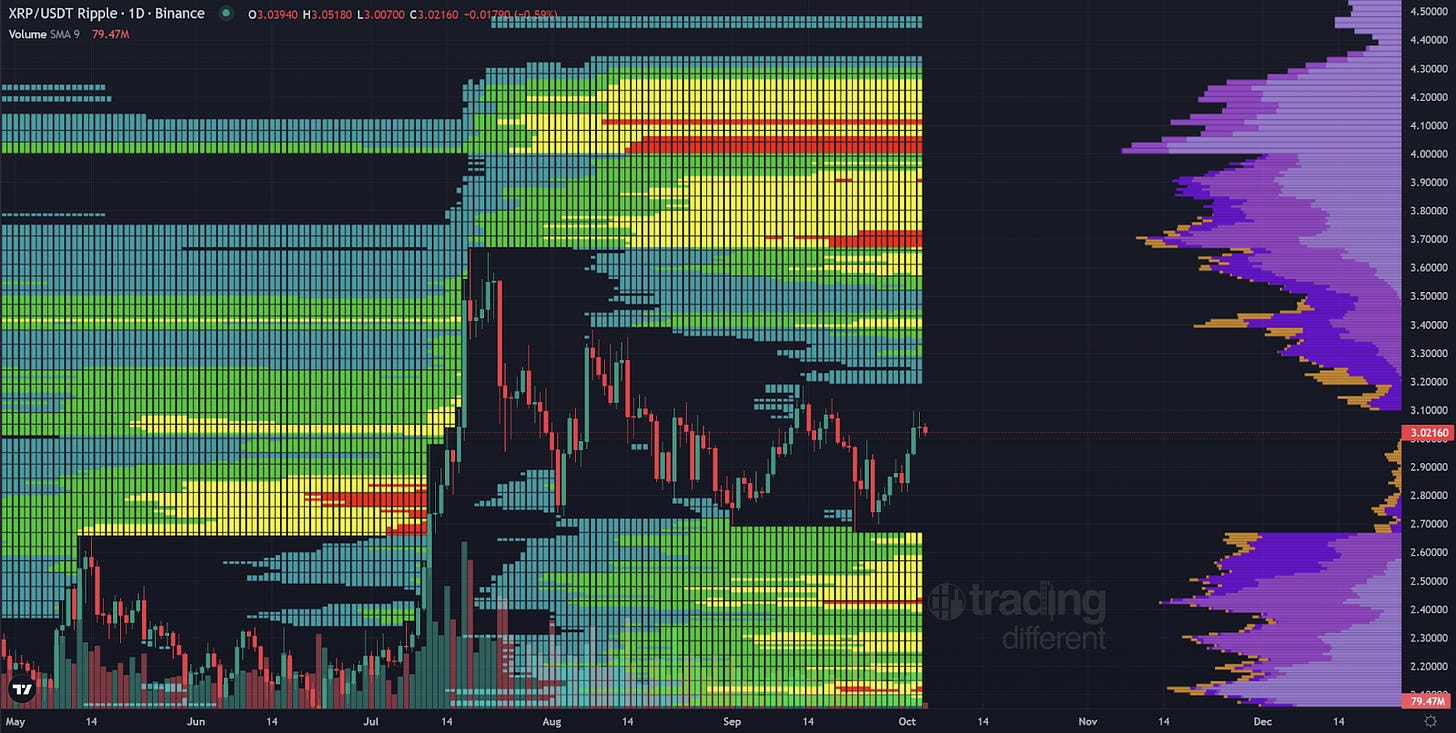
The first thing I want to draw your attention to is the $2.72 to $2.75 level. This area has acted as a key support for XRP since our most recent push up in July. We’ve consistently held above this $2.72 to $2.75 region. I don’t give an exact figure because it varies slightly between exchanges, but this zone is crucial. It marks where we first found resistance after the initial move from 50 cents, and it also aligns with the weekly all-time high from the 2017 to 2018 cycle. In other words, it’s a major structural level for XRP, and the fact that we’ve held it so far is a bullish signal in my view. To confirm a stronger continuation to the upside, we’ll need to break above $3.17, and ideally $3.65, to really validate the next leg of the move.
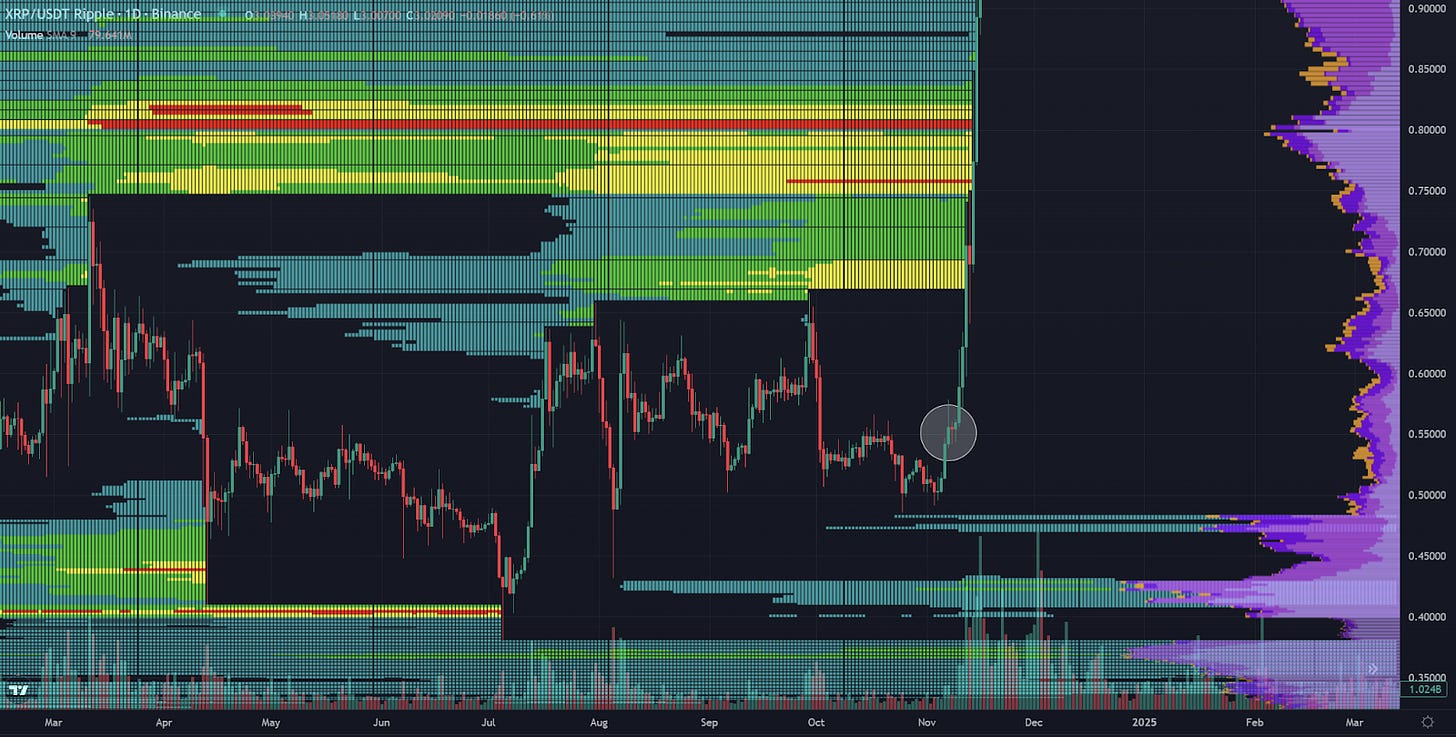
If we compare where we are now to where we could be relative to the last expansive move for XRP, there’s potential that we’re somewhere within the white circle shown above on the two charts. We’ve got a dense area of liquidity sitting above us, and we need to secure a close above what has been acting as the swing high around the 3.17 level. When we were previously in the 50 cent range, once we achieved that initial close above the 55 to 56 cent level, momentum really began to build and we started to chew through liquidity, sending price significantly higher. With the indication that Bitcoin could move to new all-time highs, there are two potential outcomes. Either Bitcoin takes liquidity first and altcoins move more slowly, or we see a situation where, as Bitcoin breaks into price discovery, everything moves together in a parabolic phase. That’s something we could easily see for XRP. I’m not saying it’s happening right this second, but I do think it could happen at any time during this period.
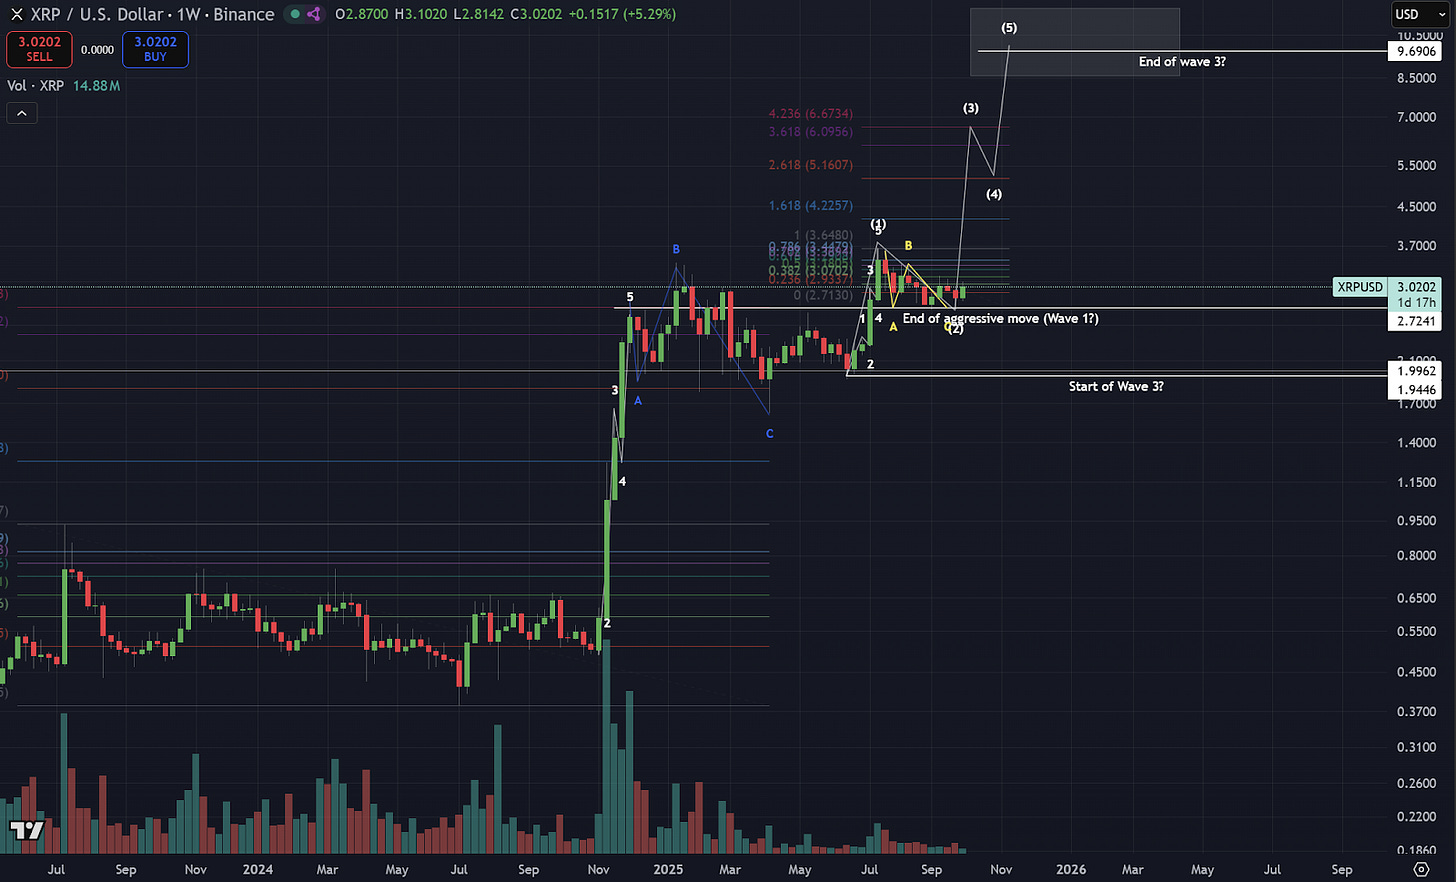
Another thing I’d like to draw your attention to is the expansion we had back in November of last year. I’d like to see more volume come in before we can confirm a similar move here and before we get decisive closures above the levels I mentioned earlier. During that last expansion, the first stopout came at the 4.236 Fibonacci extension, and I’ve suggested that we may now be forming a more complex ABC correction that could be setting up the third wave of a major third. If that plays out, a 4.236 extension would project a move towards around $6.90.
Of course, we still need to see confirmed weekly closes above $3.17 and then above roughly $3.60 before we can have more conviction in that outcome. But these are the areas I’m watching closely. From there, a retracement followed by a continuation into the fifth wave of this major third could take XRP into the $8.00 to $12.00 range. Beyond that, if Raoul Pal’s liquidity thesis proves accurate and the liquidity cycle extends into mid-2026, we could even see one final, more extended wave higher.
That said, if we do reach the $8.00 to $12.00 region, I plan to significantly deleverage (likely around 80% of my portfolio) because by that point, the potential downside risk will outweigh the upside reward in terms of lifestyle benefit. I’ll keep a portion of my holdings for any longer-term continuation, but I want to be clear that while these targets are exciting, discipline will be key when we approach them.
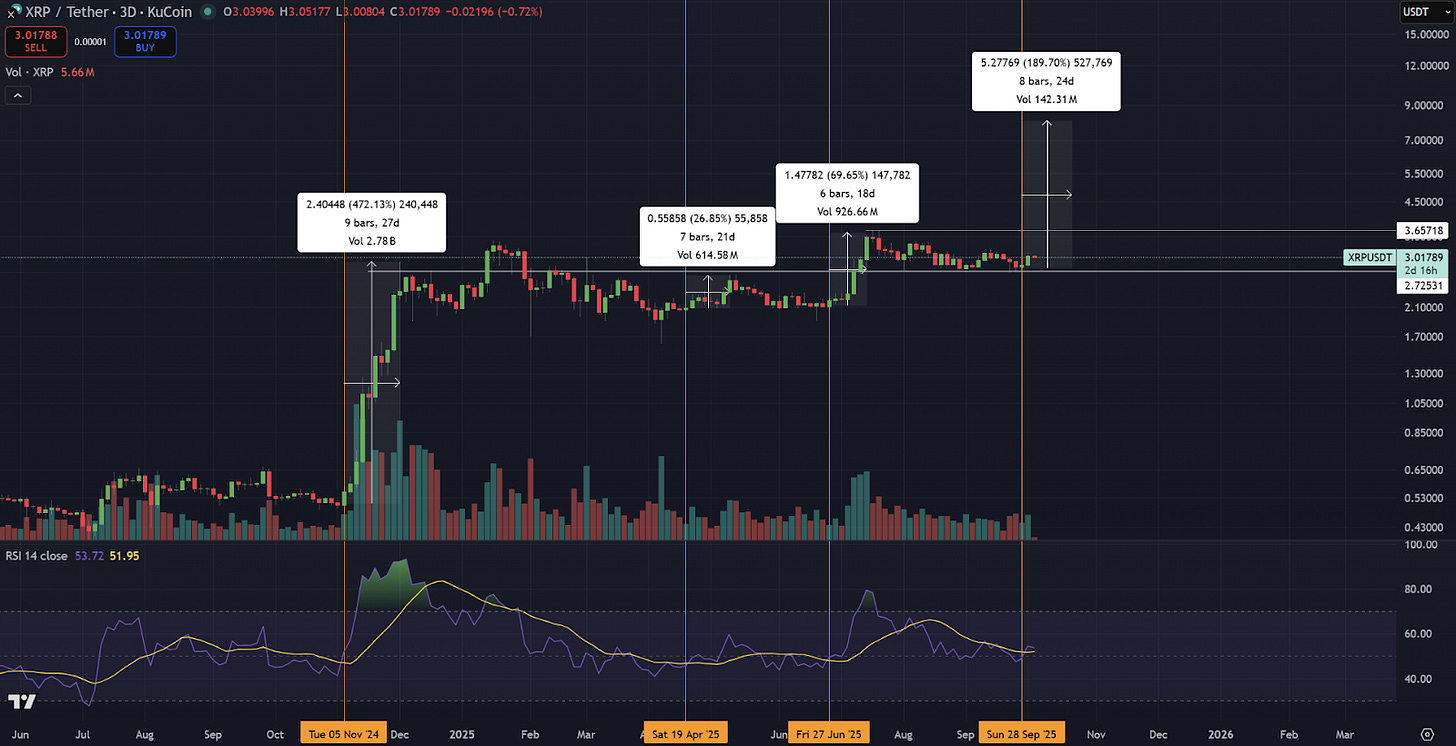
Finally, a little bit of bullish hopium for you guys. If we look at the three-day RSI relative to XRP’s price and examine the last few times we’ve had a bullish cross, the results have historically been impressive. The first recent cross came on November 5th, 2024, and from that point XRP rallied up to $2.70. The second occurred on April 18th, 2025, which produced a smaller rally of around 26 percent. The third was on June 27th, which led to roughly a 70 percent rally.
If we take the average of these three crosses, both in terms of magnitude and duration, it gives us an estimated 189 percent move to the upside over roughly a 24-day period. Now, yes, that first move was one of the largest rallies in XRP’s history, so it naturally skews the average higher, but it’s also one of the last times we saw this setup, meaning it’s worth taking into account.
If we were to see a similar outcome this time, it would project a move towards the $8 to $9 region, which conveniently aligns with my broader thesis based on the 4.236 Fibonacci extension and the Elliott Wave structure we discussed earlier. Whether it happens in exactly 24 days or not is impossible to say, but what’s undeniable is that each of the last three bullish crosses on the three-day RSI has led to substantial upside. So let’s see if history rhymes once again and to what extent.
📈 Charts Of The Week 📉
Written by @thecryptomann1 - X/Twitter
$BTC.D: Short-Term Outlook
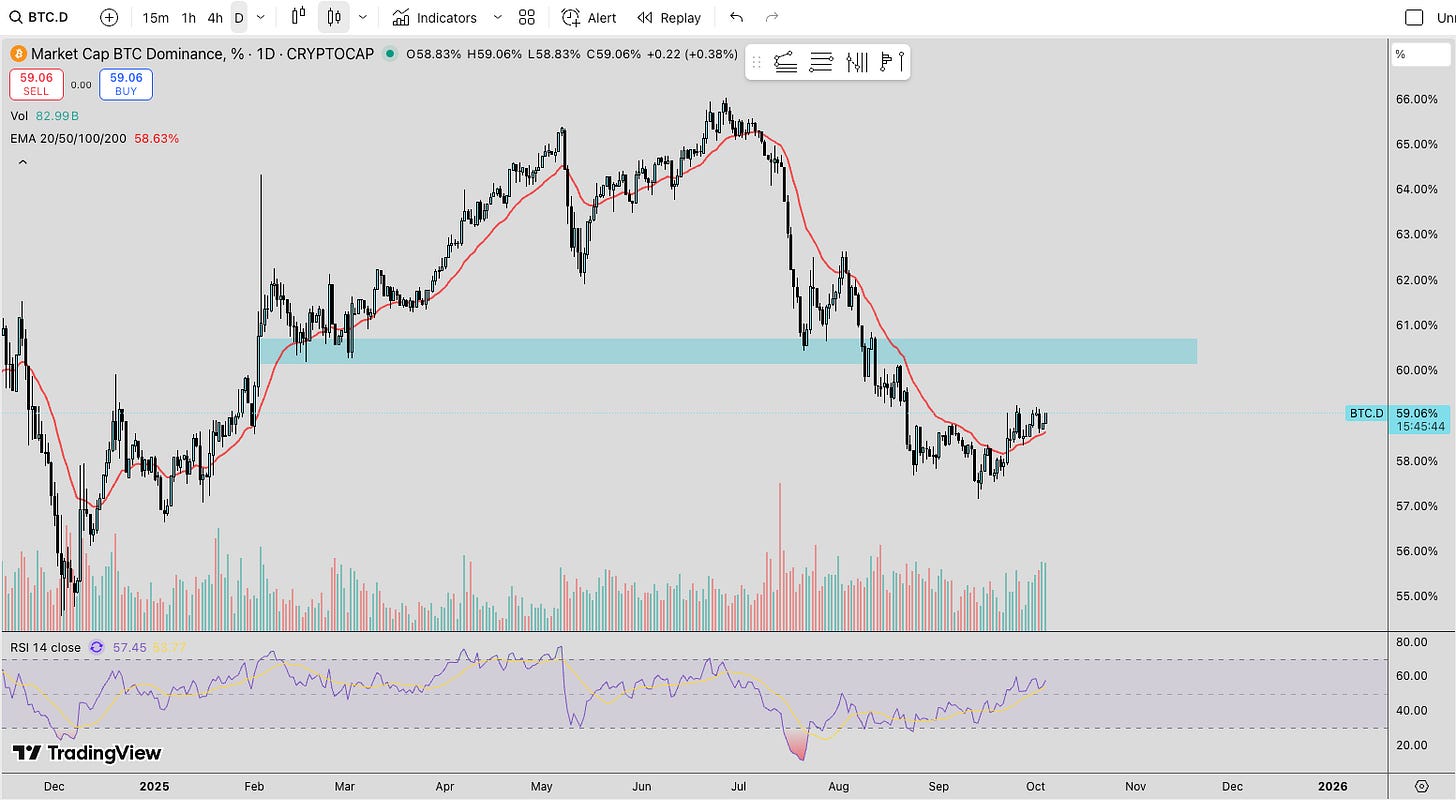
I want to use this week’s section to think out loud and put some of my current thoughts on the table. Let’s start with Bitcoin dominance. In the short term, it looks like BTC.D is heading up toward the 60–61% range.
If that plays out, what does it actually mean? Well, if Bitcoin keeps pushing to new all-time highs, then BTC will likely just do its own thing for a bit, ripping higher into price discovery over the next week or so. Once BTC.D tags that range I’ve highlighted, that’s when I think the market flips massively bullish. At that point, as BTC.D cools off, altcoins could really start to perform.
That’s the scenario I want to see unfold.
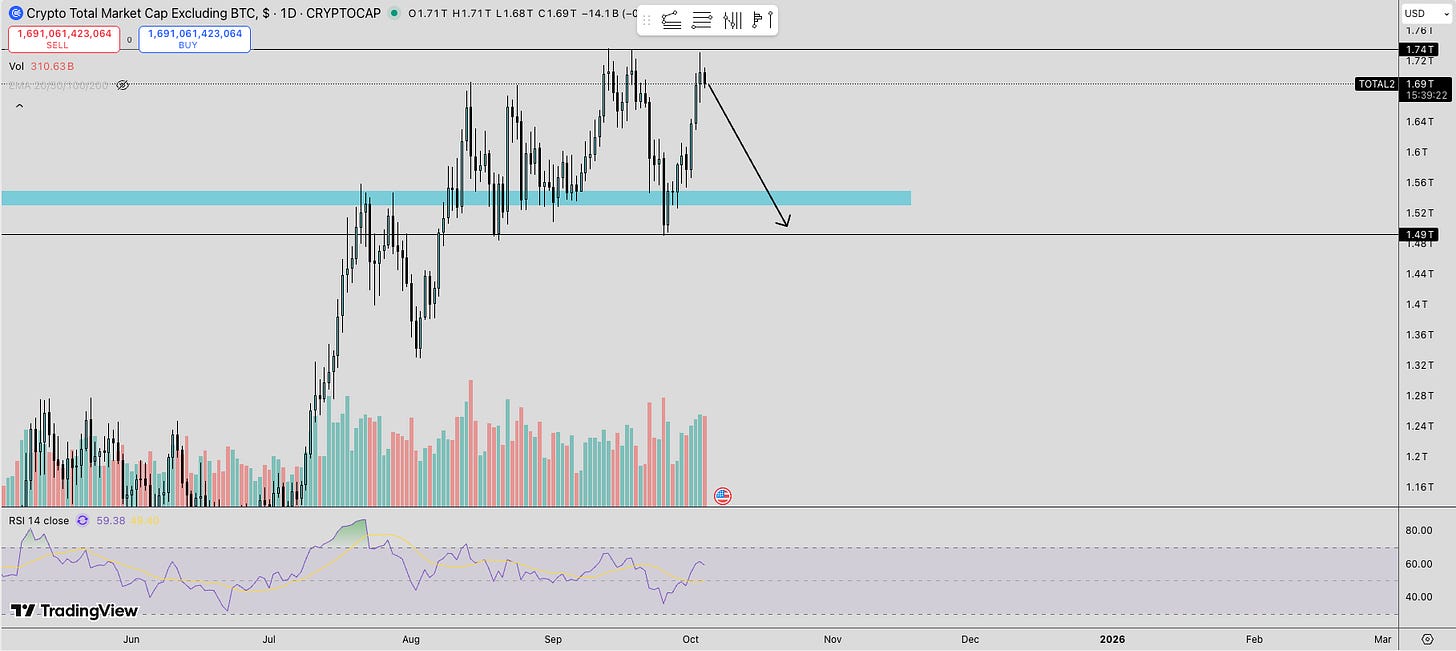
Another possible outcome is that Bitcoin rejects all-time highs and, in turn, altcoins absolutely bleed. That would cause BTC.D to climb higher. I think this is a real possibility, especially since $TOTAL2 has just rejected the top of its range.
So the question is, are we simply stuck in a game of ranges right now?
Honestly, I don’t have the answer for which way things will swing. But just in case scenario one plays out, the bullish case where things really start to send it, I want to point out a couple of altcoins I’ve been watching. These are the ones with strong hype right now and, in my view, could be relative winners compared to the rest of the pack on the way up.
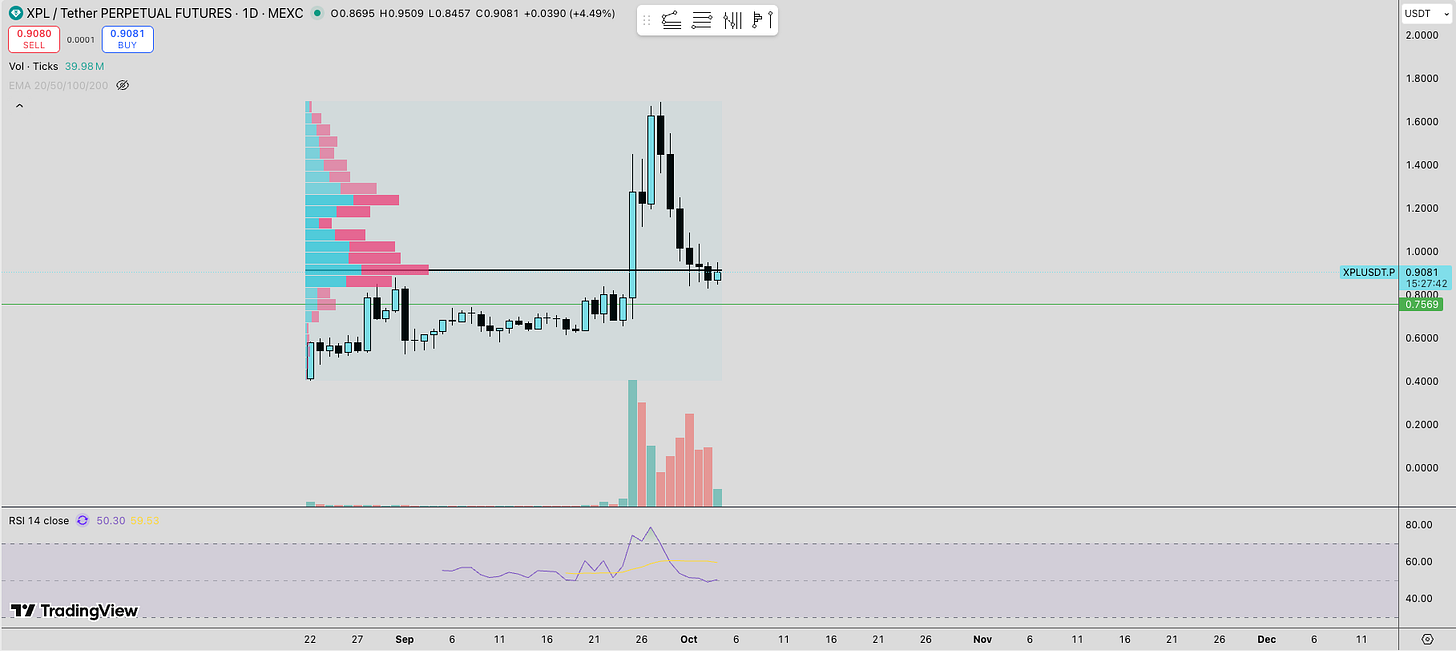
$XPL
I feel like a lot of people have been stung by this chart from what I’m seeing on Twitter, but to me it’s starting to look good. It just needs to break out of the range it has been battling. If we get a close above $0.97, I think it starts to look properly bullish.
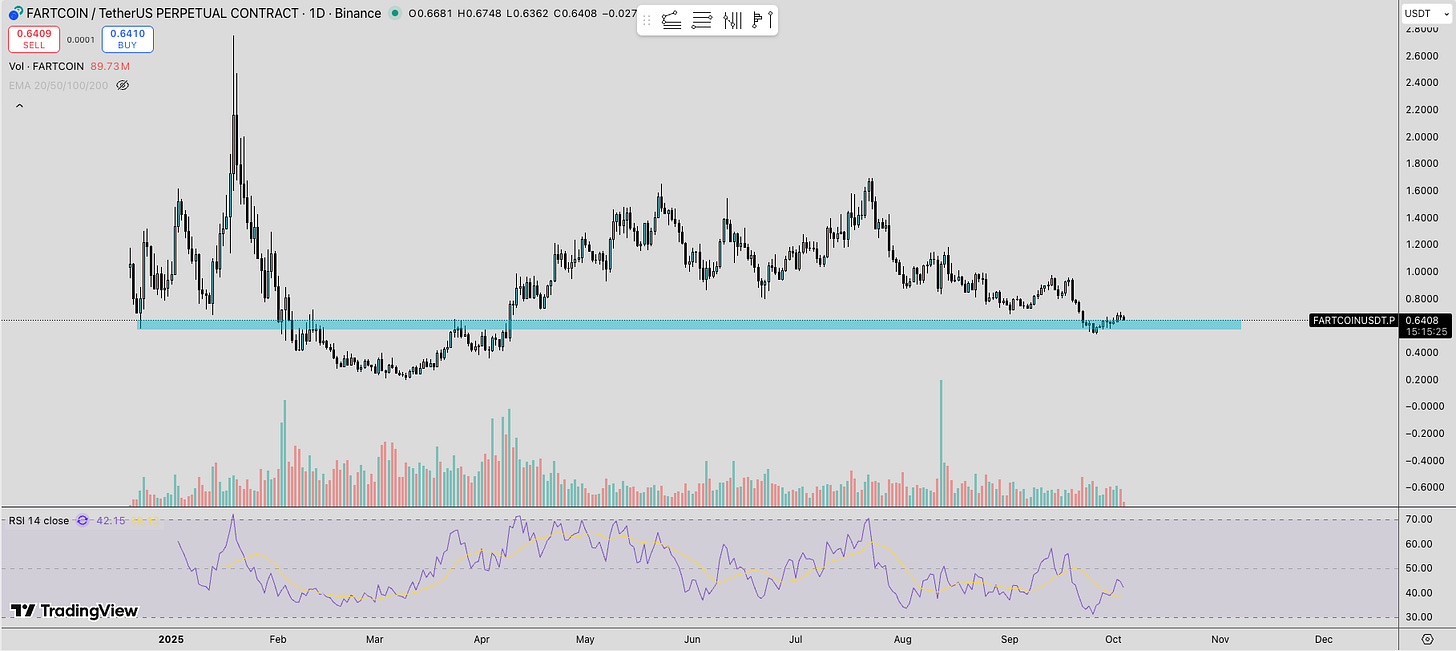
$FARTCOIN
Fartcoin is another one on my radar. Any entries in the accumulation zone I’ve highlighted below could turn out to be a strong play. It was a front runner during the last leg up, and I think it is shaping up to do the same again if bullish market conditions continue.
LINKS:
This newsletter is free because we love sharing our insights with the community. If you enjoy it and find value in our work, consider supporting Pav’s and Will’s Beer/Coffee Fund by donating $XRP to our newsletter donation wallet below. Cheers!
$XRP donation wallet: r3qf2nALyhFwC46QqZ5gJHpF3cjr5gRcoV
Trade XRP Memes here:
https://firstledger.net/?ref=6NRu4StwrImq
Trade on MEXC: https://www.mexc.com/register?inviteCode=mexc-1etb1
Trade on WEEX using this link: https://www.weex.com/login?from=https%3A%2F%2Fwww.weex.com%2FnewbieActivities%3Fid%3D520%26type%3DBEGINNER_TASK%26vipCode%3Duspf
Trading Different (Liquidity Map) - https://t.co/3ks3QMT5VJ?ssr=true


