
The war has started! What does this mean | The Weekly Insight – Week 184

The content below represents the personal views and opinions of the authors. It should not be considered as investment or financial advice.
📚 News Of The Week 🎓
Written by @CryptoinsightUK - X/Twitter
Geopolitical Tensions Rise
Iran have just been struck by Israel. A supposed joint attack by Israel and the US. That is at the time of writing. It is February 27th at 11:30 AM local time here in Dubai.
So why do I preface this newsletter like this?
For multiple reasons.
One, because there could be extreme volatility in the near term.
Two, because we have been watching this issue brew for months. Maybe even years if you go back to the first direct strikes between Israel and Iran.
And three, because in bearish periods, bottoms can form on the onset of bad news.
I am not saying number three is the definite outcome here.
But I am saying, and I have said this for a while, that when people are overly invested emotionally in an event and are deeply worried about it, that is often where markets form bottoms. Especially if you do not see strong follow through to the downside. Especially if price struggles to make new lows after the bad news hits.
That is when markets can show you that sellers are exhausted.
I relate this back to the Gemini and Digital Asset Group situation with Barry Silbert and the Winklevoss twins at the end of the last bear market. There were threats of public letters, court action, major fallout. Everyone was scared about what it meant for crypto.
The day the letter was due to come out, and actually the day before because that date was known in advance, the market bottomed.
Now am I saying that is definitely going to happen here?
No.
But I am giving you an example of where something similar has happened before.
With that context in mind, let us break down the price action.
Bitcoin: Liquidity Still Below
If we start with the hourly liquidity on Bitcoin, what we can see is that there is liquidity sitting down around 60K.
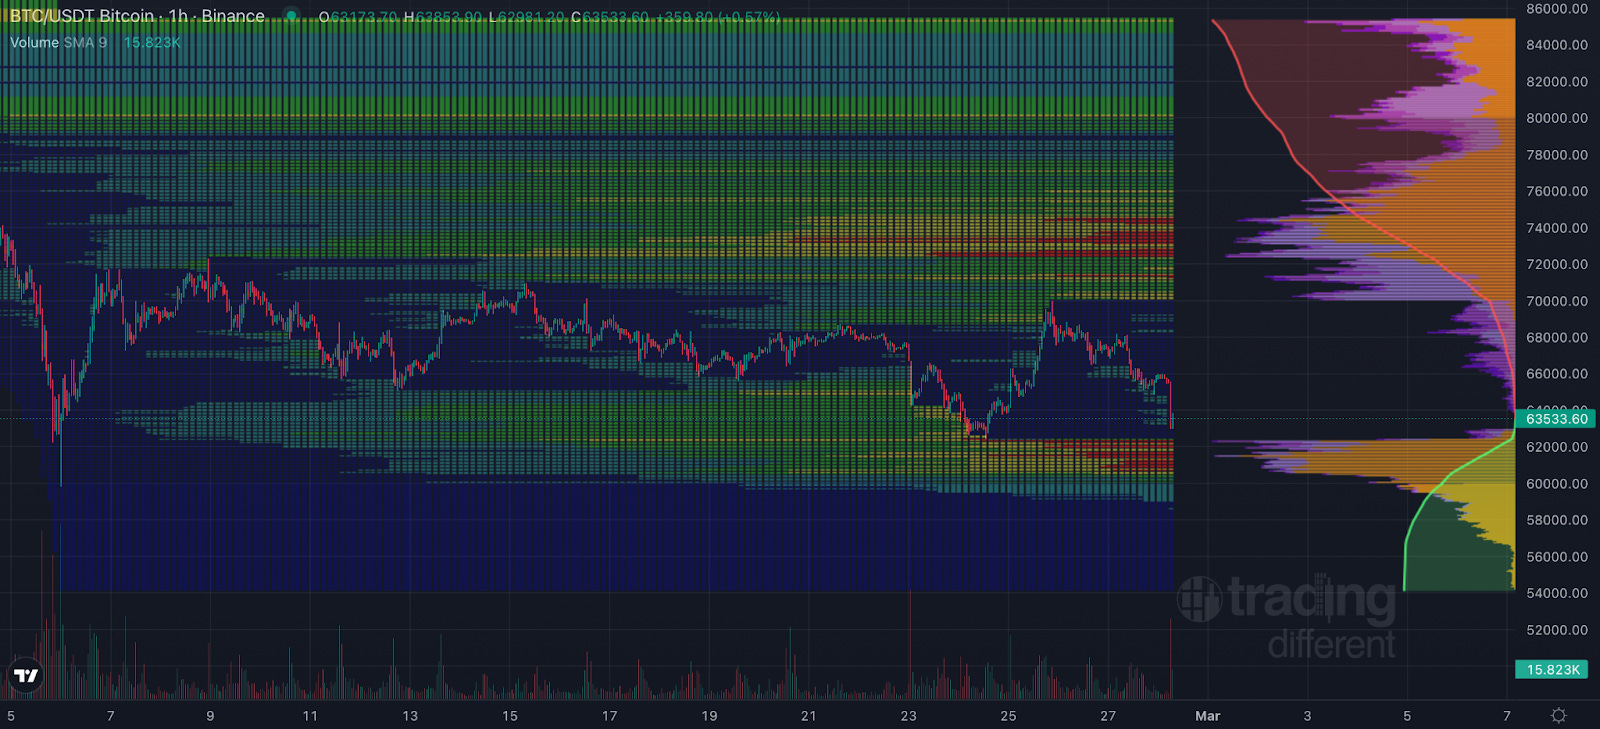
Yes, we had an initial dump on the onset of the news. You can see it clearly with the red candle and the spike in volume at the bottom right of the screen. But the follow through price action has not been strong enough to sweep that liquidity yet.
Personally, I would like to see that liquidity taken before we start heading higher.
Right now this is putting the idea of a potential double bottom on the table for Bitcoin.
Now we have to be realistic. The strike only started about an hour ago at the time of writing. Anything can happen from here.
But even with the initial panic and the shock of the strike, price has not made new lows. It has not even properly double tested the bottom, despite liquidity sitting there to be taken.
That is at least an initial positive sign.
Still, from a technical perspective, I would prefer to see that liquidity swept before we look for a more sustained move to the upside.
Ethereum: Similar Structure
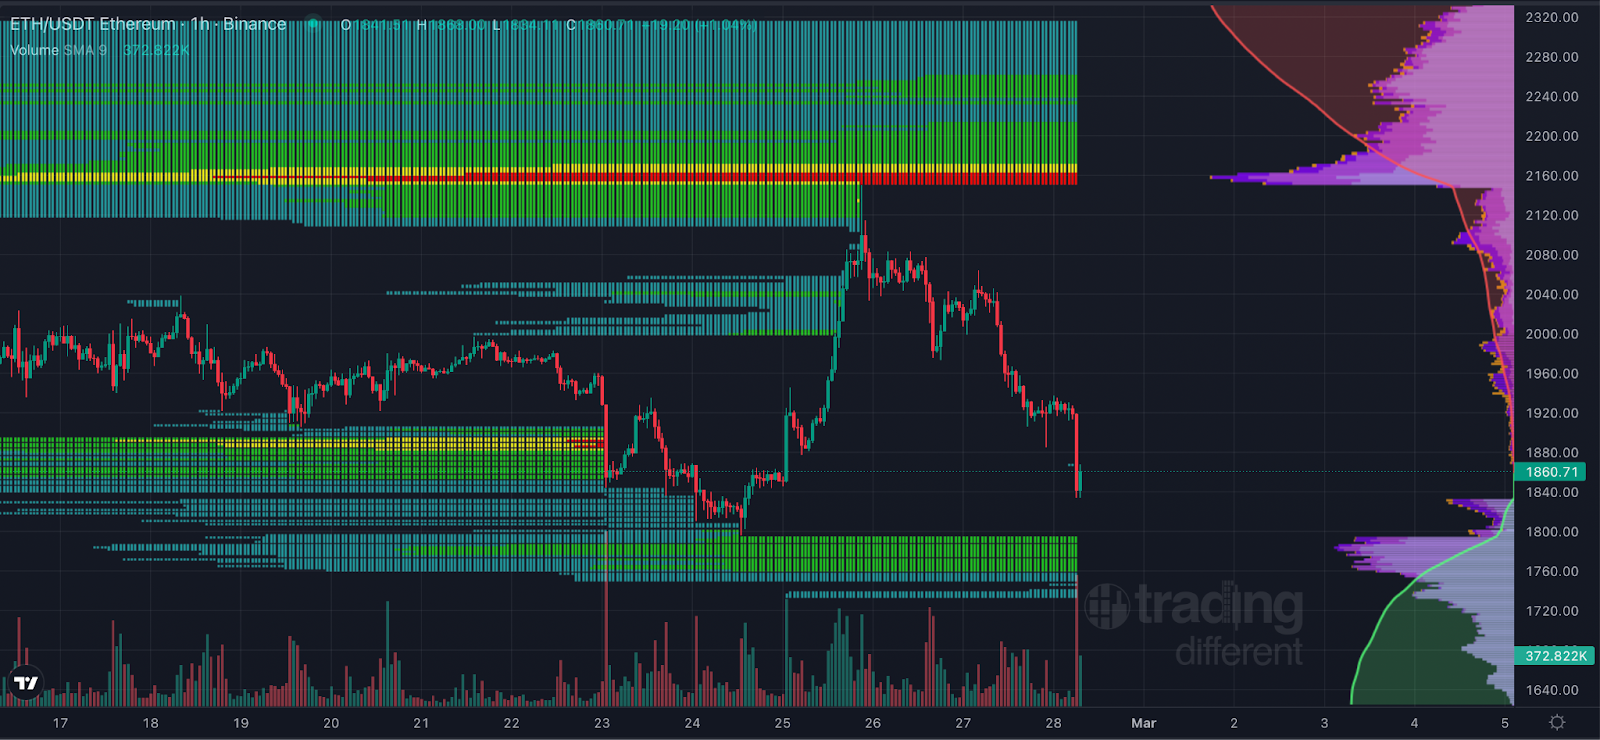
Now it is a similar story with Ethereum.
There is still some downside liquidity that could be taken before we head higher, down to around 1,720 dollars.
But just like with Bitcoin, most of the low timeframe liquidity is actually sitting above us.
So yes, there is room for a sweep lower.
But structurally, the bigger pools of liquidity are not beneath price. They are above it.
XRP Showing Relative Strength?
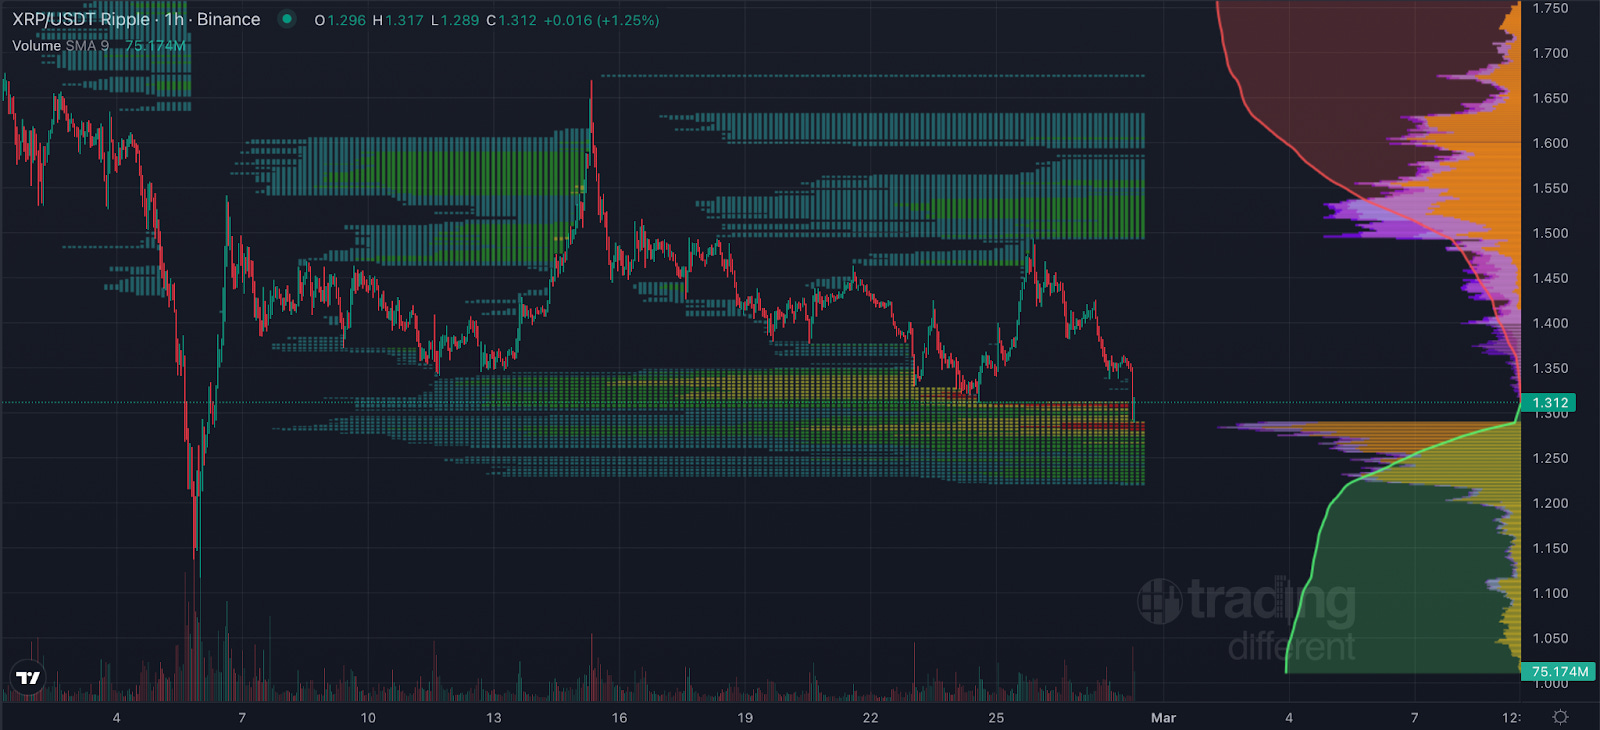
Now if we look at XRP, it actually looks a bit different.
Even structurally, XRP had a spike to the upside about ten days ago that Bitcoin and Ethereum did not have. It showed relative strength there.
And now XRP has already moved down into the liquidity pools that Bitcoin and Ethereum are still waiting to touch.
So in a way, XRP has already done what the others have not.
I have been discussing the possibility of XRP leading altcoins and potentially leading the market generally. And maybe this is just a low time frame hint of that.
It is not confirmation.
But it is interesting that XRP is already entering liquidity and reacted, while Bitcoin and Ethereum are still sitting above theirs.
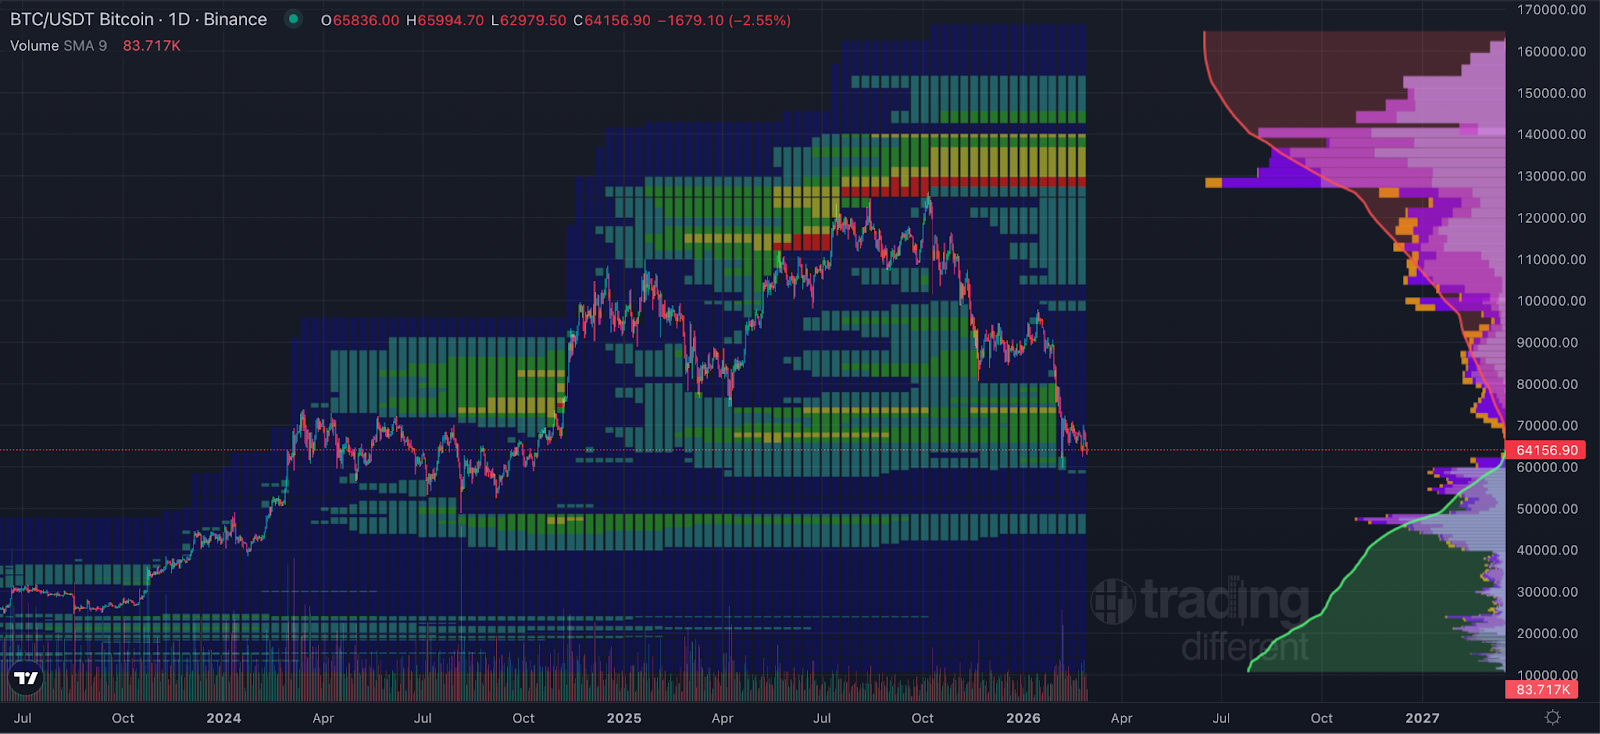
So everything we have discussed so far has been low time frame liquidity.
And as always, the high time frame picture has not changed.
The significant liquidity still sits above us on the daily.
I am using Bitcoin as the example here because my broader argument is about altcoins and why I think they are going to outperform. But I still think Bitcoin goes to all time highs.
I keep repeating this because I want to get across how I feel about the market generally.
If Bitcoin has this much liquidity above us, and I believe it eventually trades into that liquidity and makes new all time highs, and at the same time I believe altcoins are going to outperform Bitcoin, then the implication is obvious.
Altcoins should do something crazy.
That is the simple equation I keep coming back to.
Bitcoin Dominance: Volatility About to Expand?
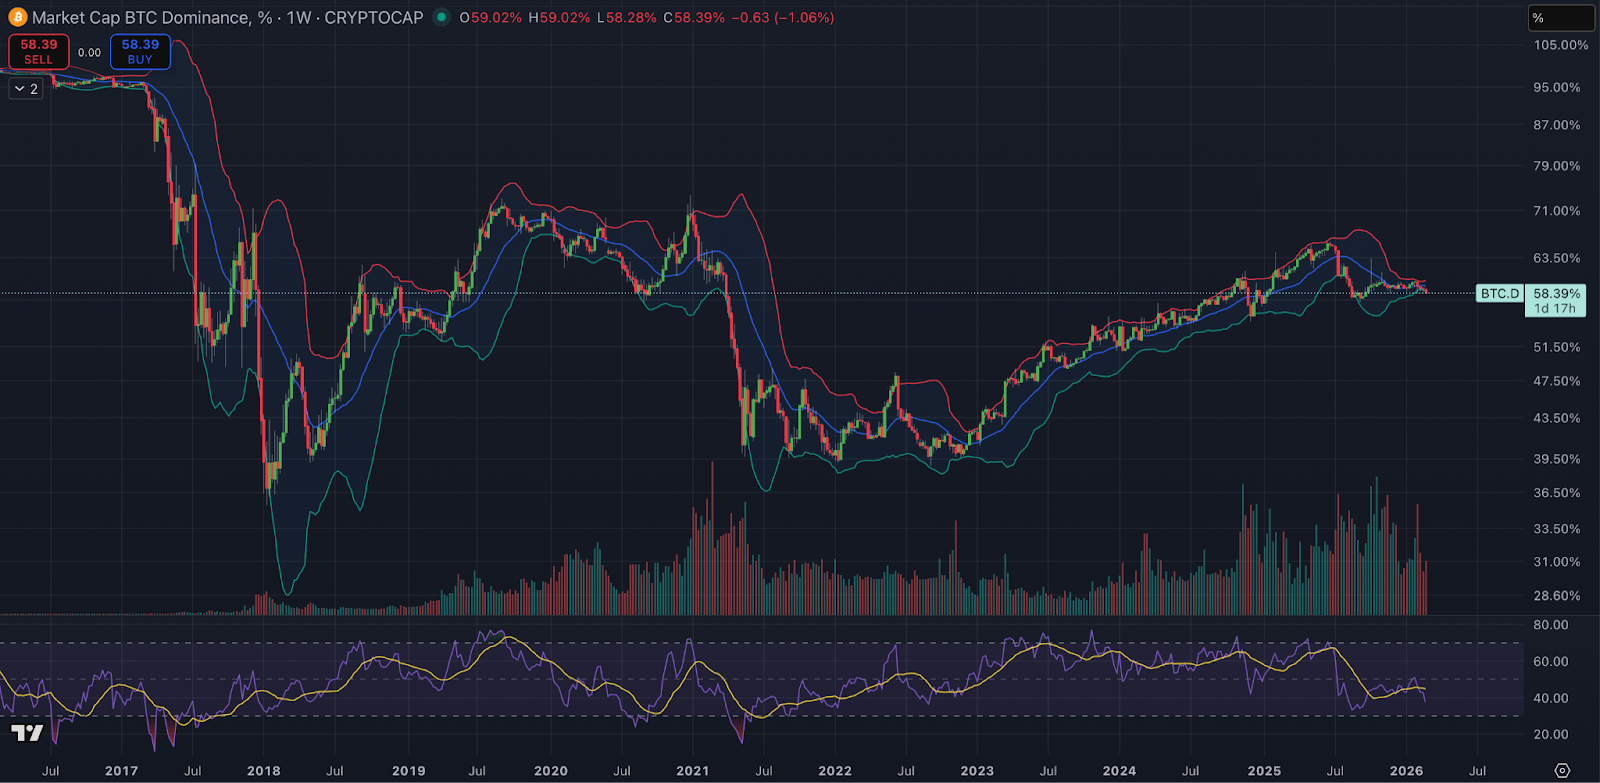
We are one day and 17 hours away from a weekly close.
Bitcoin dominance Bollinger Bands are the tightest they have ever been.
But it does look like we are starting to see some weakness in the price of Bitcoin dominance.
If that continues, this could be the first stage of that volatility finally being realised, and realised to the downside.
And if that is the case, that would be positive for alts.
NB. So long as they’re not just dropping less than BTC (which could be possible, but would be an absolute first, something we’ve never seen during a negative period for crypto).
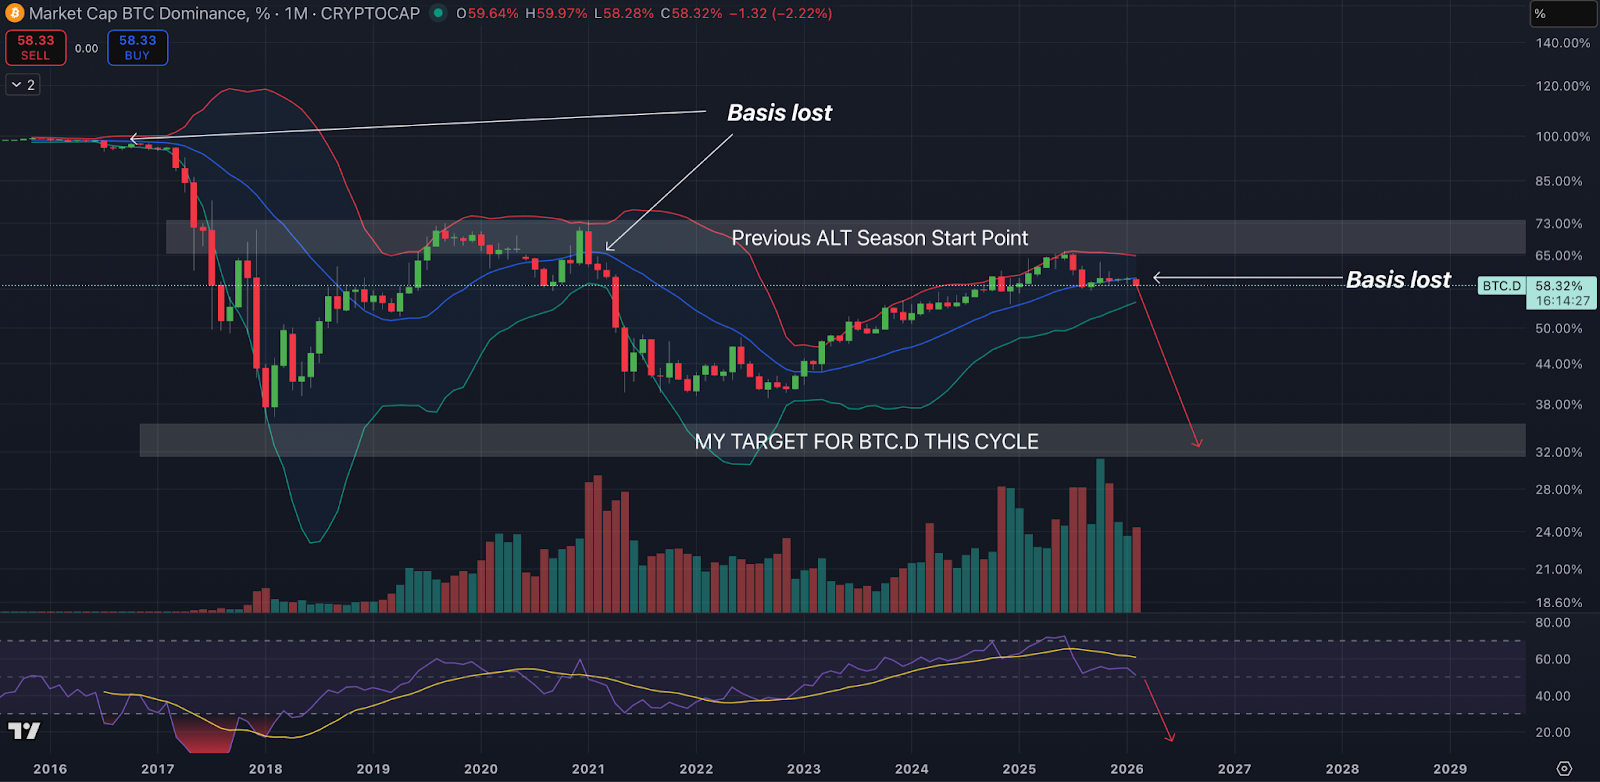
I also wanted to share Bitcoin dominance on the monthly with the Bollinger Bands.
Why am I bringing this up?
Because the monthly closes in just 16 hours and 14 minutes from the time of writing.
If we look at the monthly Bollinger Bands on Bitcoin dominance, they are again extremely contracted. Similar to where they were at the lows in 2023 before we moved up toward that recent high around 65 percent. And the time before that they were this tight was in 2021 at the highs, just before the 2021 alt season, when dominance dropped from around 73 percent down into the 40 percent region.
So why am I drawing on those two occasions?
One, because of how tight volatility is right now.
And two, because we have just lost the basis of the Bollinger Bands, the blue line that runs through the middle. That line often acts as a simple gauge of bullish or bearish momentum.
If we get this monthly close where we are now or lower, and yes there are still 16 hours left, it would suggest that this contraction could resolve to the downside.
If you also look at the RSI on the monthly, that is leaning bearish and looks like it could lose the 50 level.
When I stack all of that together, it tells me that when this volatility is finally realised, the momentum could favour the downside for Bitcoin dominance.
And if Bitcoin dominance moves down, that means altcoins take a greater share of the market.
XRP vs Ethereum
And to finish off my section this week, if we are going to suggest that altcoins are going to outperform, then why not look at the relationship between our favourite altcoin XRP and the second largest altcoin in the space, Ethereum.
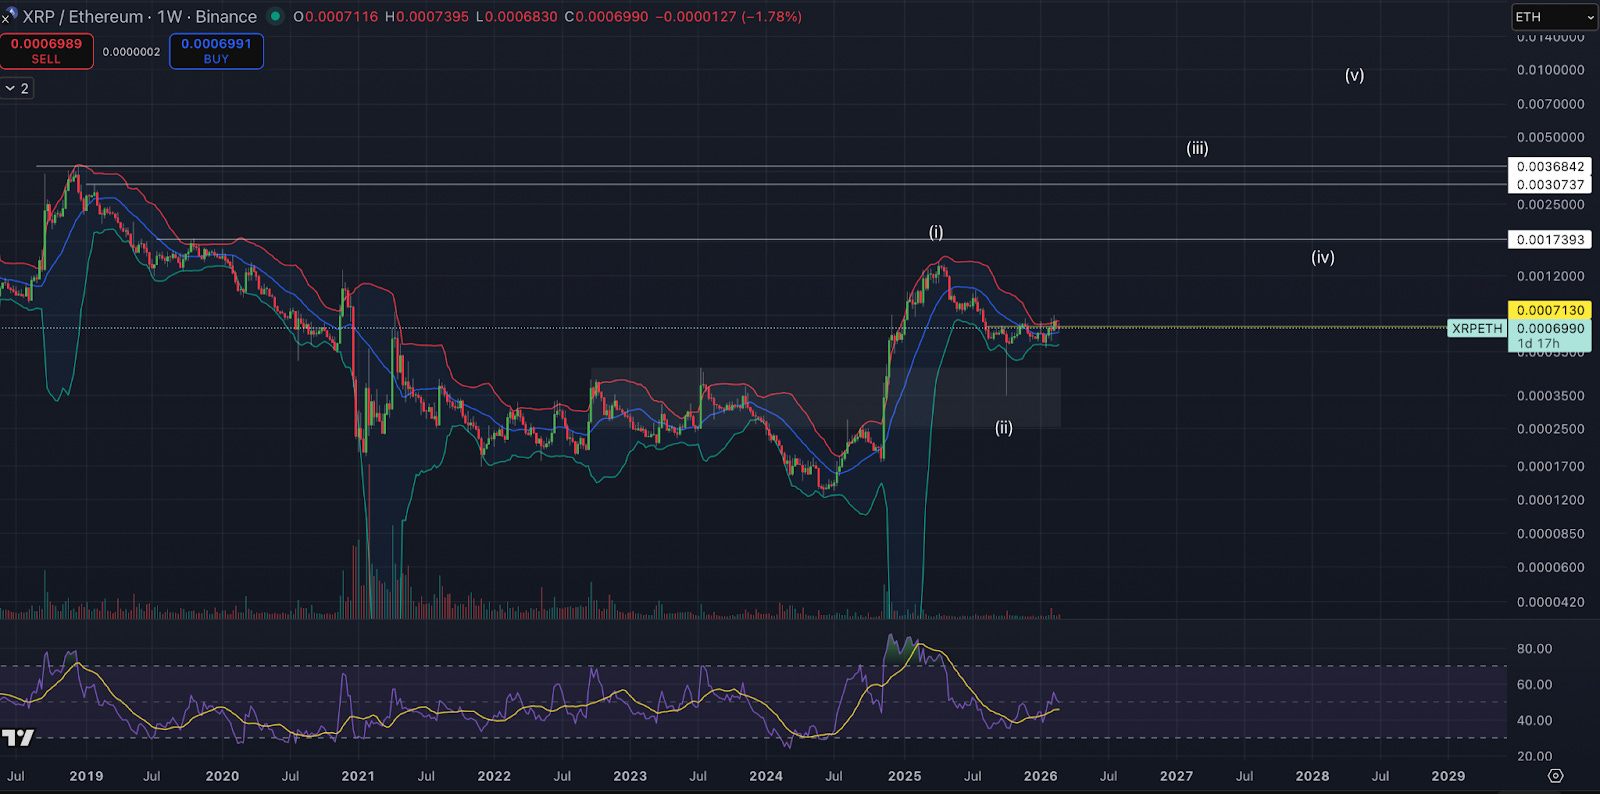
As I have said multiple times, I think XRP against Ethereum has started a new trend to the upside. In simple terms, that would mean XRP starts taking market share away from Ethereum.
I do not know for sure whether this is just a corrective move or something bigger. But I am suggesting the possibility that this is the start of a five wave move up.
If we overlay the Bollinger Bands on the weekly timeframe for XRP against Ethereum, it looks like volatility is about to expand. I am obviously suggesting that expansion could be to the upside.
We are holding above the basis, the middle blue line we discussed earlier with Bitcoin dominance. Holding above that level supports the idea of bullish momentum continuing.
So if you combine Elliott Wave theory suggesting a new impulsive structure, Bollinger Bands suggesting incoming volatility, XRP holding above the basis, Bitcoin potentially going to all time highs, and Bitcoin dominance leaking into altcoins, the equation becomes quite simple.
It suggests that XRP could be setting up for an explosive move.
That is the framework I am looking at.
The big question is, WHEN?!?!
📈 Charts Of The Week 📉
Written by @thecryptomann1 - X/Twitter
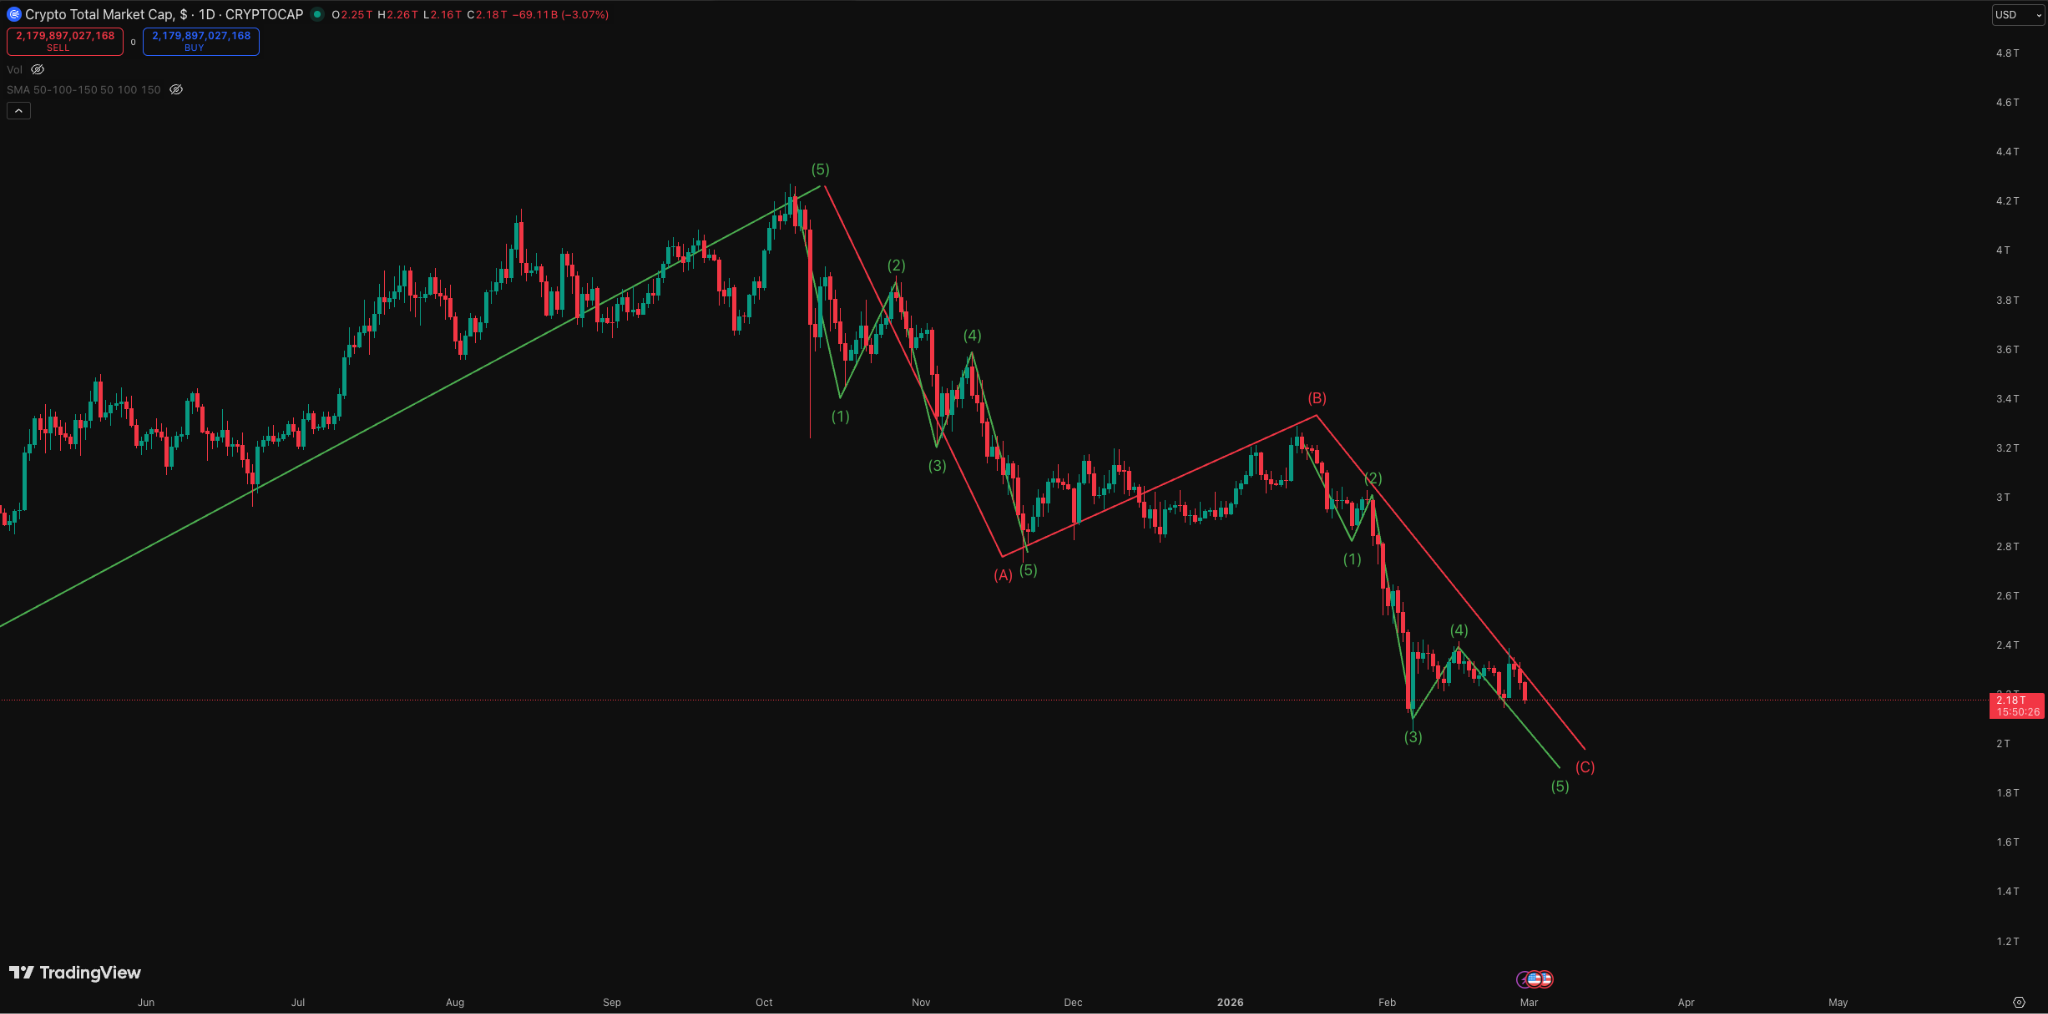
$TOTAL Market Cap Elliot Wave
I’m not entirely sure how deep to go into the strikes happening in Iran as we speak.
What I will say is this.
Over the past few weeks, I’ve been discussing the Elliott Wave structure on the total market cap chart. And when I first mentioned it, I very clearly said that a geopolitical shock, such as a strike on Iran, could be the catalyst that pushes us down into the final leg of this corrective structure.
More specifically, the fifth wave of the C leg within the broader A, B, C correction.
If you look at the structure objectively, we’ve been grinding lower in a way that still allows for one final flush. A sharp move driven by uncertainty, fear, and headline risk would fit perfectly within that Elliott Wave count.
Now, I’m not saying this has to happen. Markets do not move purely based on headlines. But when you combine rising geopolitical tension with a corrective structure that still looks incomplete, it’s something you cannot ignore.
If we do see that final push lower, it may not be the end of the world. In fact, structurally, it could mark the completion of this corrective phase.
Sometimes markets need a reason to flush. Sometimes they just need an excuse. And this could be one.
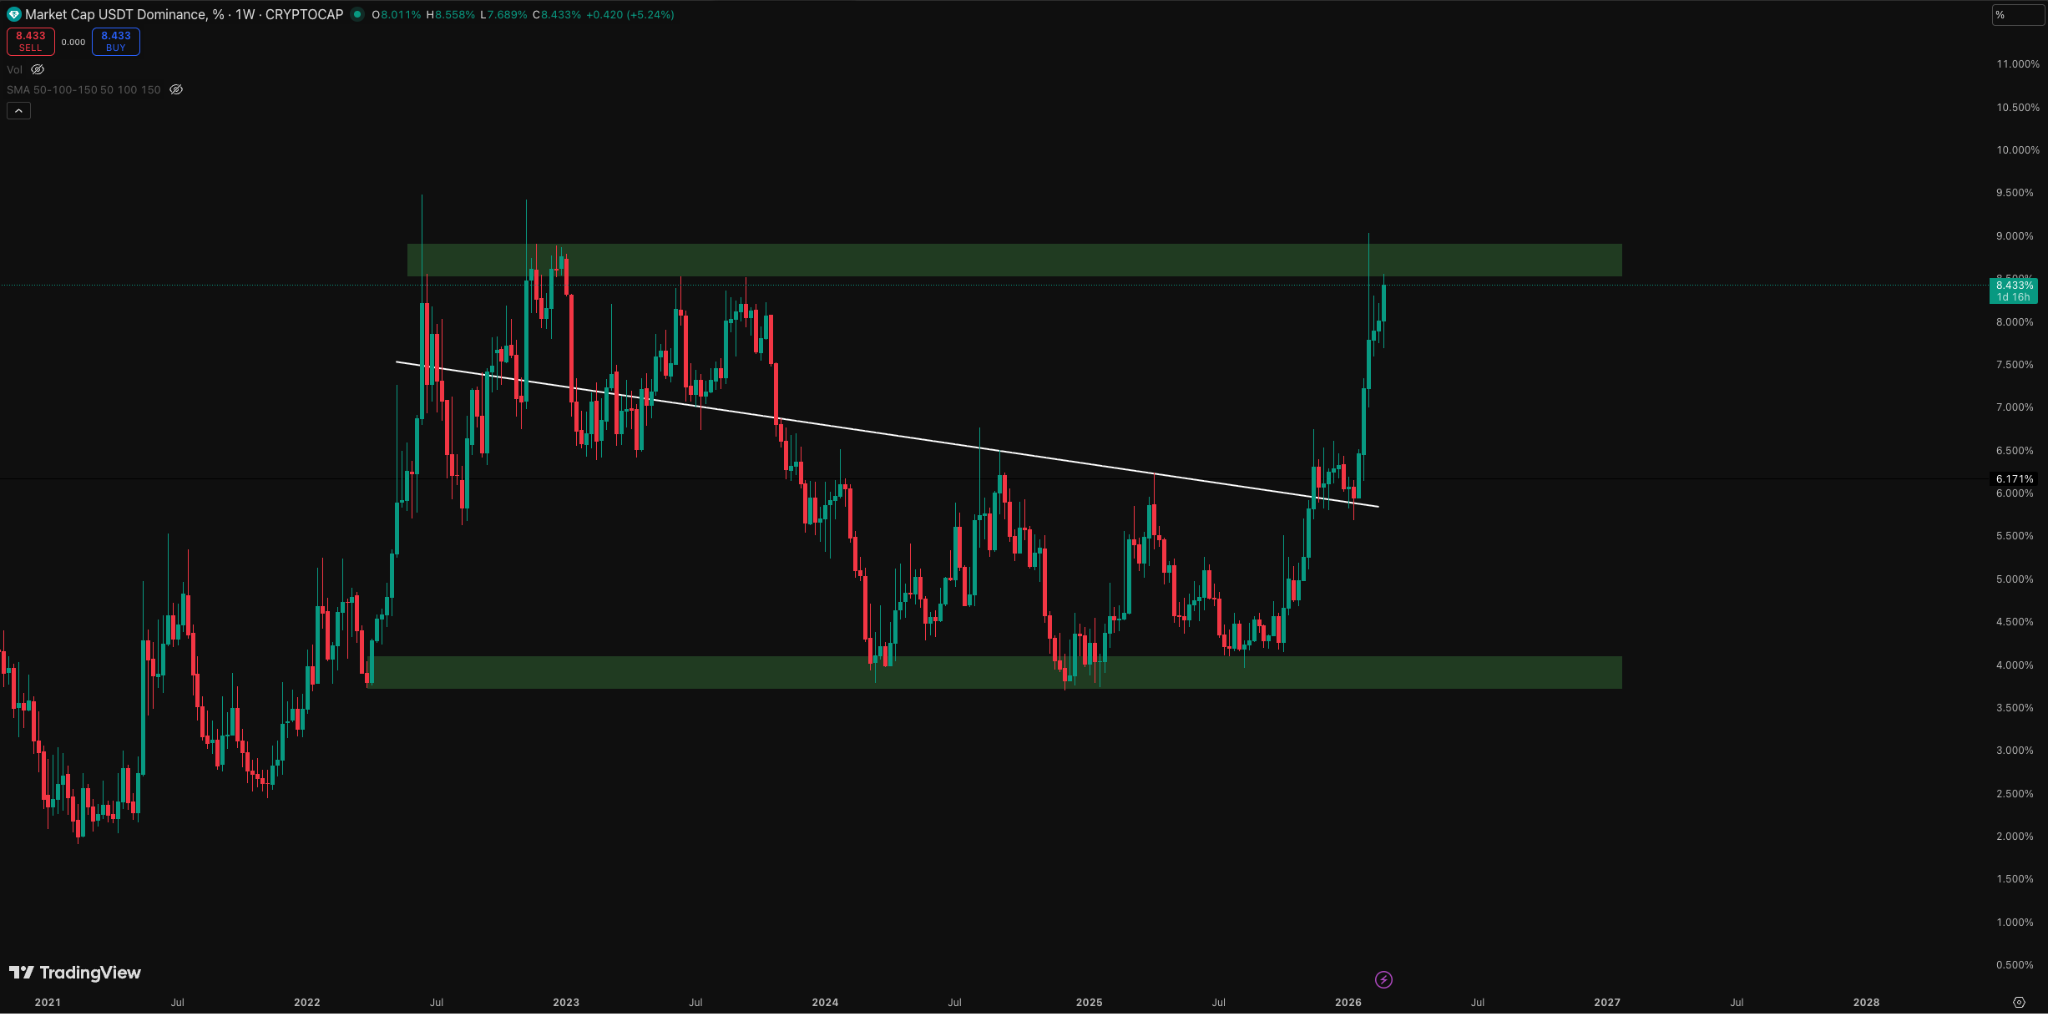
USDT.D
But the real question is, how far do we actually go?
I’m not sure. No one really is. But when I look at the USDT.D chart, it’s sitting right in the region where markets have historically bottomed.
If you look at it the way I normally do, as a simple range, we’re currently at the top of that USDT.D range. And every time we’ve been up here before, it’s marked fear, stress, and local bottoms in price.
So when I frame it like that, it still makes more sense to buy into this fear than to sell into it.
Some people will think that’s stupid because we could still wick lower. Others will think it’s obvious. For me, it’s a no brainer. Risk to reward up here favours leaning into the panic, not running from it.
Then when USDT.D rotates back down into that lower green zone at the bottom of the range, that’s when I’ll start looking to de-risk and take profit.
Simple range logic. No overcomplicating it.
LINKS:
This newsletter is free because we love sharing our insights with the community. If you enjoy it and find value in our work, consider supporting Pav’s and Will’s Beer/Coffee Fund by donating $XRP to our newsletter donation wallet below. Cheers!
$XRP donation wallet: r3qf2nALyhFwC46QqZ5gJHpF3cjr5gRcoV
Trade XRP Memes here:
https://firstledger.net/?ref=6NRu4StwrImq
Trade on MEXC: https://www.mexc.com/register?inviteCode=mexc-1etb1
Trade on WEEX using this link: https://www.weex.com/login?from=https%3A%2F%2Fwww.weex.com%2FnewbieActivities%3Fid%3D520%26type%3DBEGINNER_TASK%26vipCode%3Duspf
Trading Different (Liquidity Map) - https://t.co/3ks3QMT5VJ?ssr=true