
Everyone's WRONG about $XRP? The Weekly Insight - Week 161

The content below represents the personal views and opinions of the authors. It should not be considered as investment or financial advice.
📚 News Of The Week 🎓
Written by @CryptoinsightUK - X/Twitter
Staying Bullish Amid the Noise
Hello guys, let’s start with a clear reiteration. I am bullish. I also want to acknowledge that at times it can be extremely difficult to stay bullish and this has been one of those times.
It began with Ansem calling for a top a few weeks ago and just recently this week Blockchain Backer announced that he sold a third of his portfolio at a time when he had literally said he would be getting most bullish once the Russell broke into all time highs. The Russell has broken into all time highs yet his narrative flipped and he sold a third. You can form your own opinion on why, but the fact remains that he shifted his stance. To me, that looks like an emotionally backed sale no matter how it is justified. And that is fine because we are all human, but it is not how I would structure a portfolio. If I were planning to take capital off the table, I would communicate that well in advance, not in reaction to emotion.
On top of that, I have had Benjamin Cohen taking a little victory lap on me this week, arguing that Bitcoin dominance could not go any lower. It did, then bounced a little, and now he is using that move to claim vindication. I will be discussing Bitcoin dominance in more detail later in this newsletter, but to me it feels premature for victory parades.
I am not saying any of this to dig at anyone. My point is this. If you are feeling emotional difficulty in this market, so am I. I am getting pushback from all sides for staying bullish and that can weigh on you. But I also do not really care. My commitment is to give you my honest opinion every time.
So once again, I am bullish. I am in the same boat as you, navigating the noise, staying focused, and taking the hits that come with having conviction. Let’s get into the newsletter.
Sentiment and Local Lows
Before we get into it, Raoul Pal and Julien Bittel have released an absolute banger of a video perfectly timed with the market sentiment.
MUST WATCH - (8) Raoul Pal on X: “Time for a LIVE update of the Everything w/ @BittelJulien... Enjoy! https://t.co/fH9AUhXFNc” / X
First off, I want to touch on sentiment. Right now sentiment is at fear. Previously, whenever we have had a reading of 40 or below, as you can see on the chart above, it has lined up with either a local low or very close to the low before the next move higher. That does not mean we could not see a slight further correction, which I will discuss later in this newsletter. What it does mean is that we are very close to, if not already at, the lows both in sentiment and potentially in price.
Bitcoin Liquidity Picture
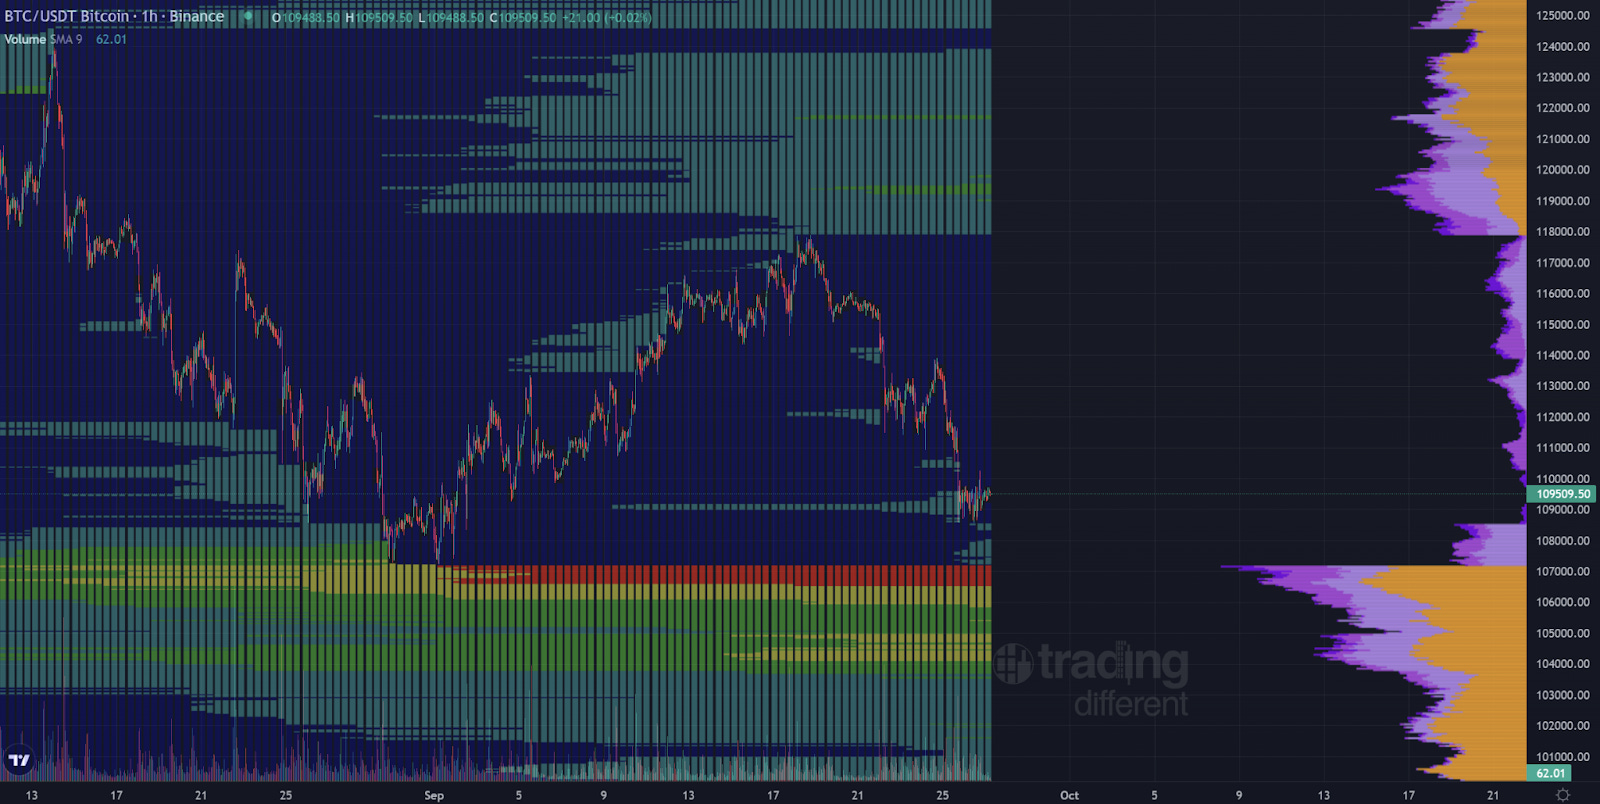
As I said, I am not ruling out the possibility that we come slightly lower because the 106k liquidity level on the hourly has been there since mid July, and when we are this close to it, you have to expect that it gets taken. I honestly think this is the last real barrier before we can begin the next parabolic move to the upside. I would expect this 106k area of liquidity to be taken, maybe even down to 104k with a wick. I cannot see the future, so I cannot say this for certain, but when we have been this close for this long and that liquidity has not yet been removed, even after Bitcoin reached 123k, I think it is more likely than not that it gets cleared sooner rather than later.
That is for Bitcoin. However, this is not something to get bearish about, and this is also why I have not given specific predictions for where I will be bidding on altcoins, because I do not know exactly how they will react to Bitcoin at this stage. I will discuss that more in a moment. What I do want to stress is that there is no need to panic if we see Bitcoin move into the 106k or even the 104k region. That is where I believe the lows will come in. Yes, we could always overextend slightly lower, and there are some structural areas that could be discussed, but I will not dive into them here. Instead, I want to use the rest of this newsletter to explain why I remain bullish and why I believe the bigger picture still points to significant upside.
Liquidity Above vs. Below
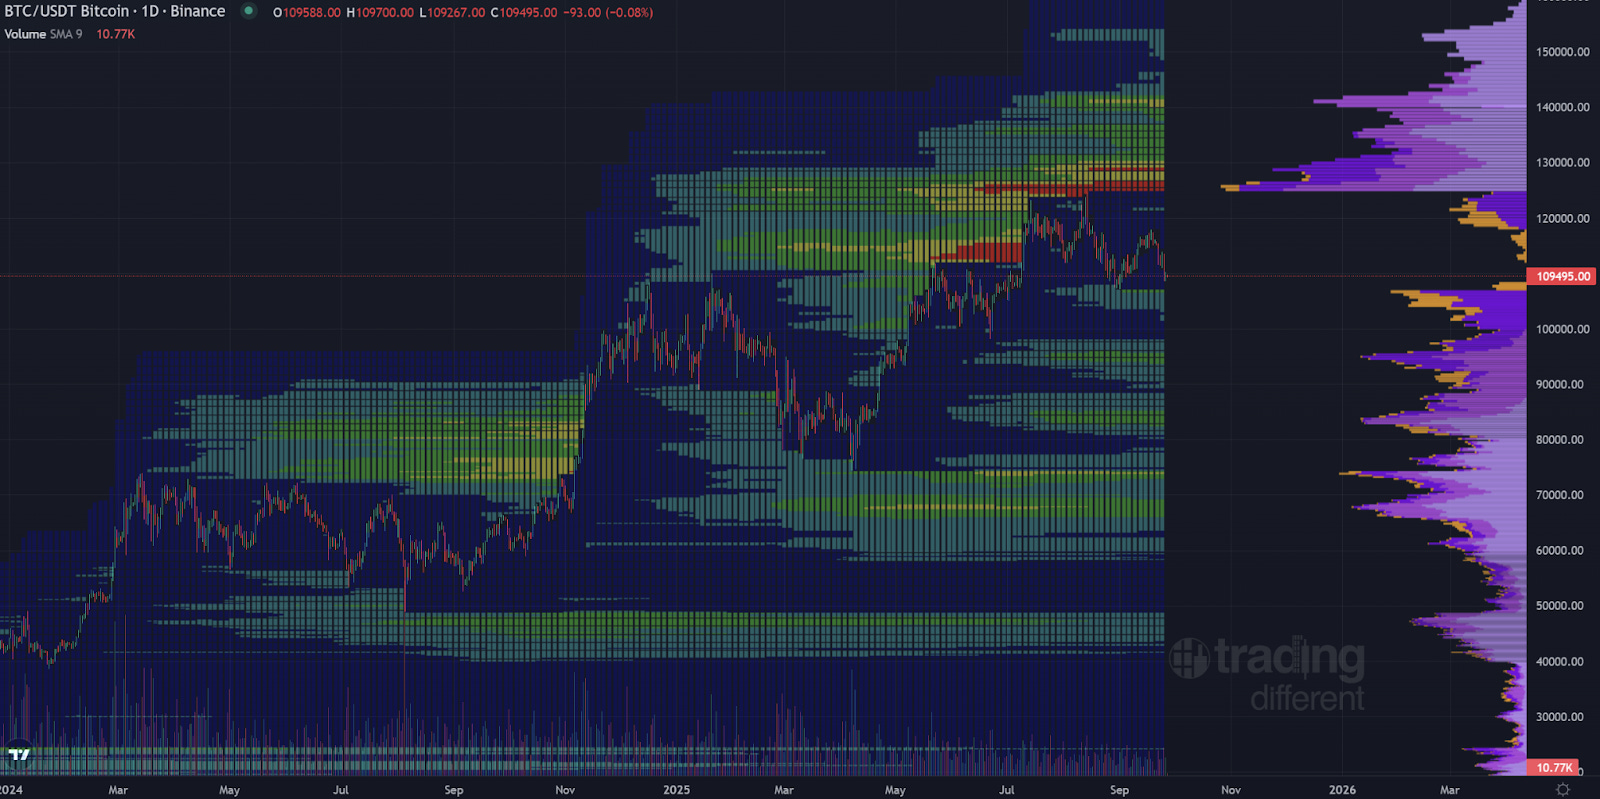
First off, looking at Bitcoin, we currently have the largest amount of liquidity ever sitting above us. If we were truly anywhere near a top, I do not believe that the market makers, manipulators, or whales would allow that much liquidity to remain untouched. Those positions are essentially shorts, and at some point they will be taken, because the reality is that not that many people are allowed to win their trades. That is not how the market works.
Secondly, if you look at this chart, you can see that even down below at 70k the liquidity is beginning to dry up. This tells us that traders in those regions have already been taking profits or closing out their positions. For me, this suggests there is now less weight pulling price action downward, and that we should be focusing on the bigger picture, which is the larger timeframe move to the upside for Bitcoin.
Altcoins: The Bigger Picture
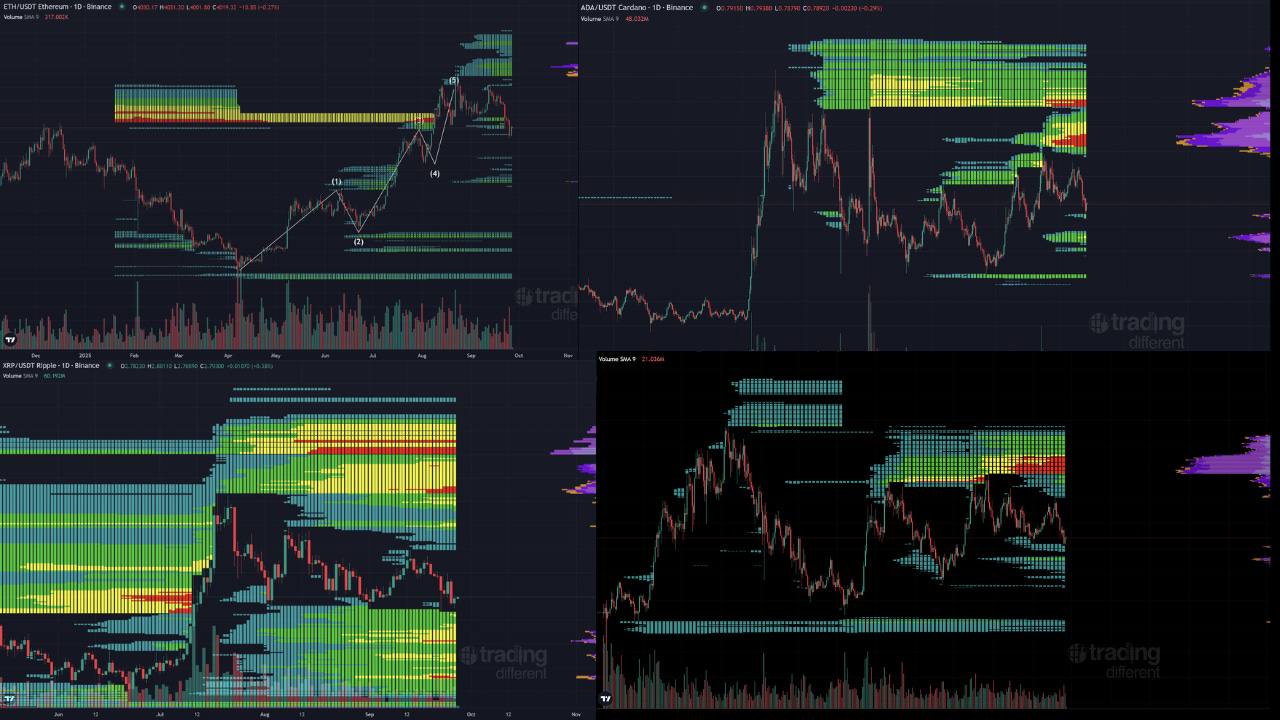
Next, we are looking at a variety of altcoins. In the top left we have ETH, top right Cardano, bottom left XRP, and bottom right SUI. On the daily timeframe, all of these charts show significant liquidity sitting above current price levels. Even ETH, which recently cleared out multi-year liquidity, has already started to build liquidity above us again. This suggests that altcoins are positioning for another leg to the upside.
Now, there is an argument that we could see a little more downside first. Each of these altcoins does have some minor liquidity sitting below, but nothing on the scale of what is waiting above. This is part of the reason why it is difficult to pick exact levels right now. The broader takeaway, though, is that the ultimate outcome looks like a move higher.
ETH Oversold, Bitcoin Dominance Overbought
When we do get pullbacks, they often feel awful in the moment. But if you compare this with last week’s newsletter, current sentiment indicators, and the liquidity picture, all of these things point toward us being near a bottom rather than a top. I am not ruling out the chance of a small move lower, but in my opinion the bigger trend is clearly up from here.
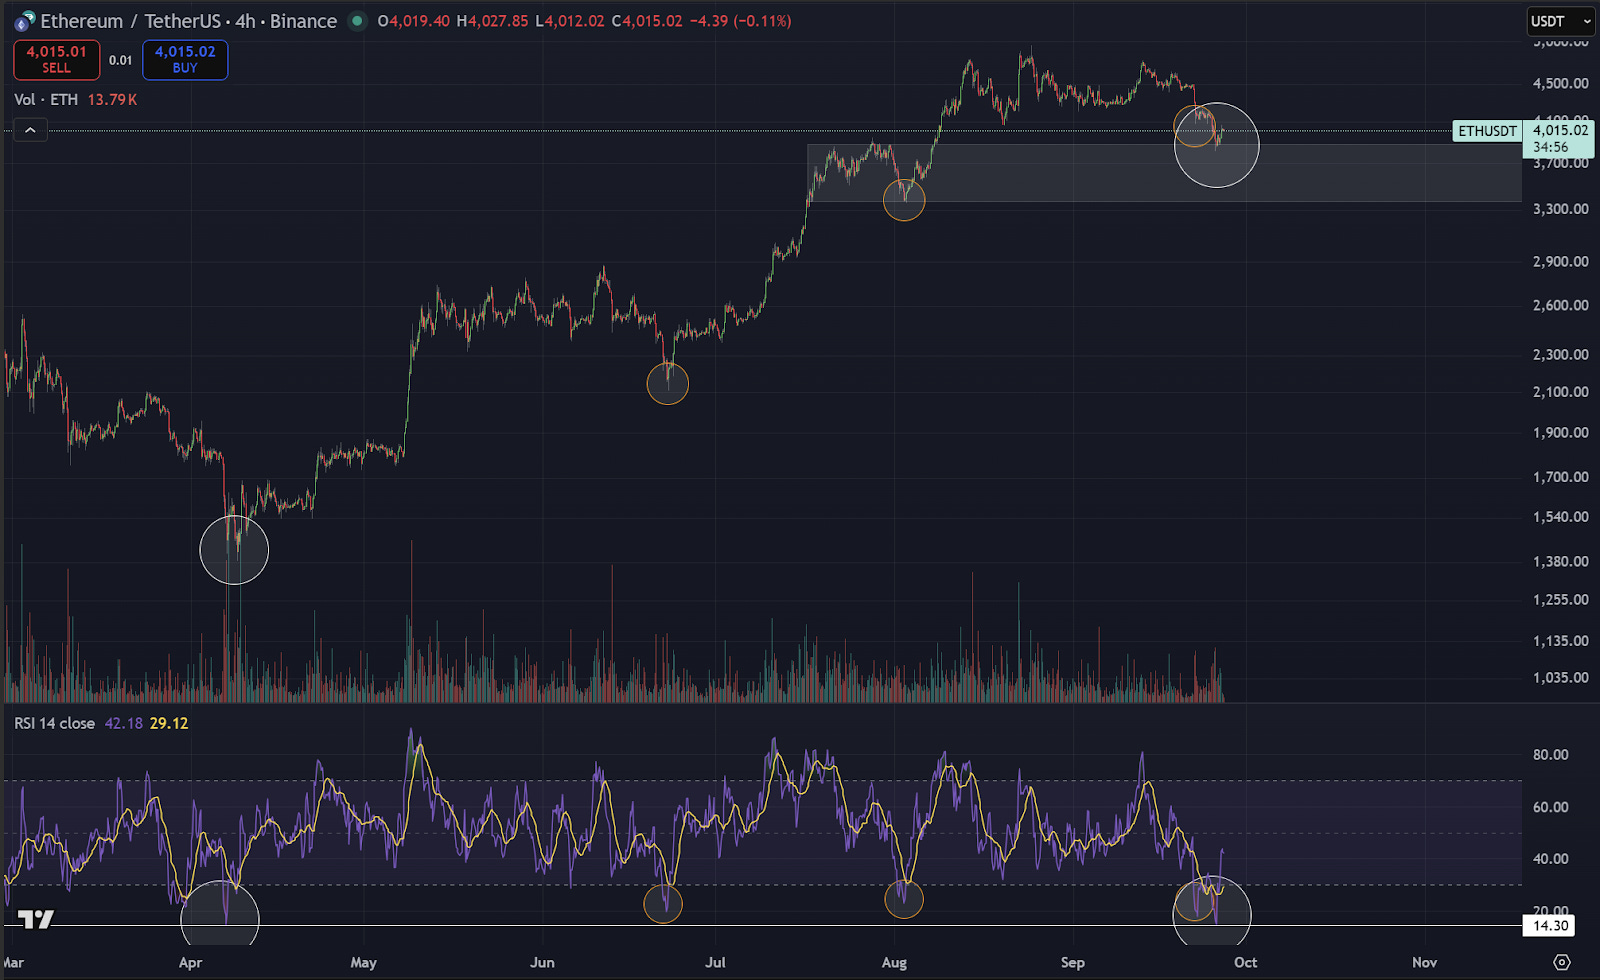
To add to this, the largest altcoin in the market, ETH, is now as oversold on the 4-hour timeframe as it was at the exact bottom of this cycle. That bottom was around $1,400, from which ETH rallied all the way up to $5,000 without ever reaching this level of oversold again on the 4-hour.
There were times along the way where ETH dipped into the oversold area, though not as deeply, and those points are highlighted by the orange circles on the chart. Even then, they marked local bottoms or swing lows before the next rally. Over the last few days, we have seen one white circle and one orange circle form, with the white circle marking the exact low and the orange circle marking local lows. Both came at moments when sentiment was at its worst, when everyone was capitulating and turning bearish, and both coincided with ETH pulling back into support.
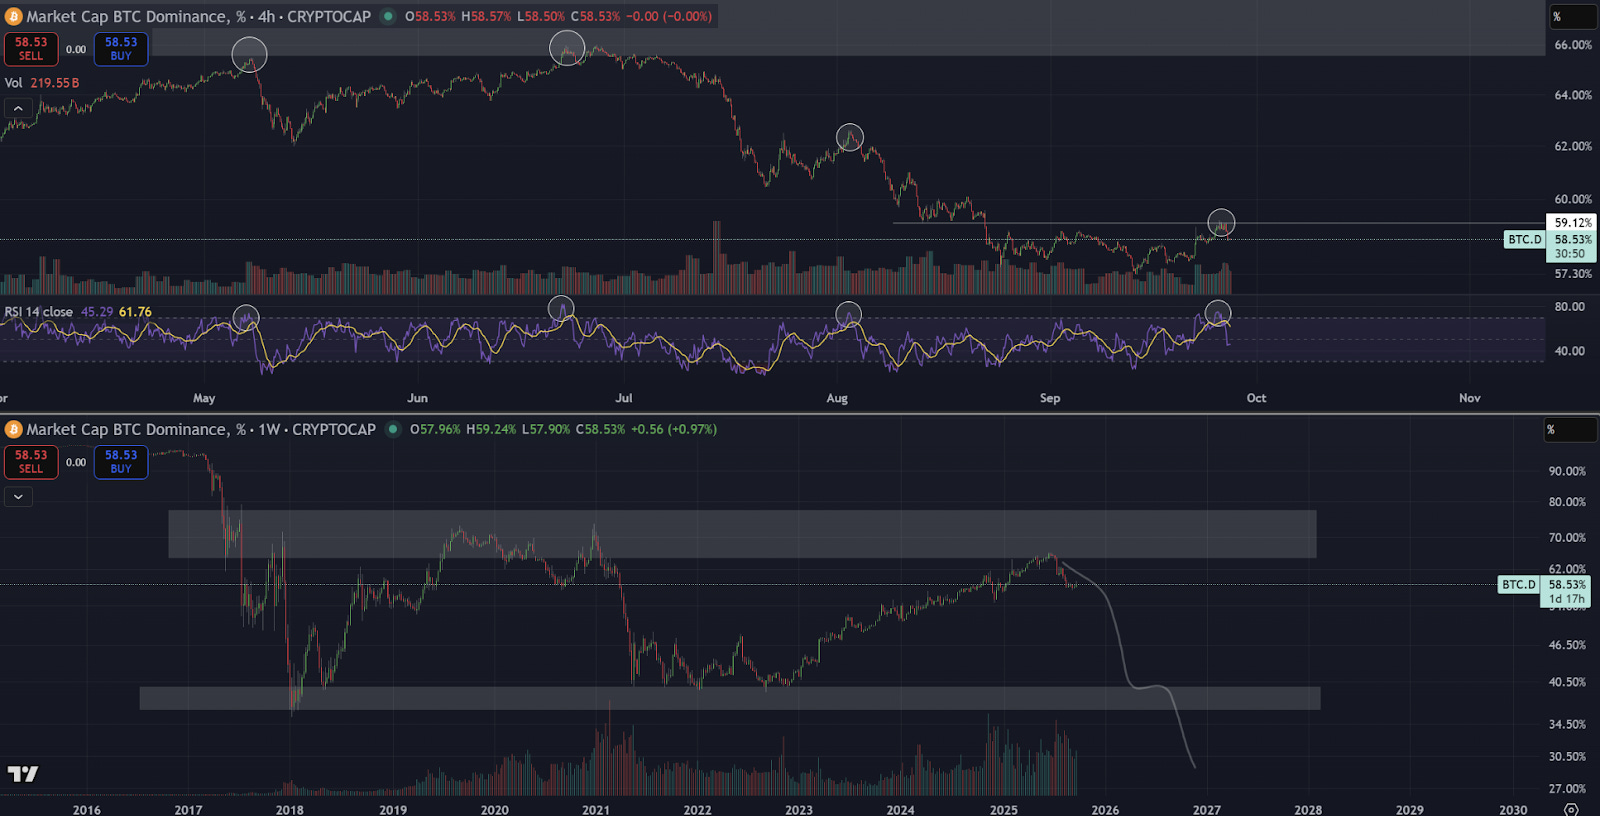
To add to the discussion about altcoins, we can also see that Bitcoin Dominance on the 4-hour has now hit the overbought area. The last three times this happened, it marked either a local high, the exact high, or came just before a larger drawdown in Bitcoin Dominance. If we look at the second half of the chart, which is the weekly view, that is the type of structure I think Bitcoin Dominance will eventually follow.
Now, do I know whether that timing is exact? No. But what we can clearly see from the weekly, and as I have highlighted in previous newsletters, is that there comes a point where Bitcoin Dominance accelerates sharply to the downside. The question is whether that moment is now.
If Bitcoin has a short-term pullback, could that flush altcoins again? Possibly. I cannot say for certain. What I can say is that ETH is deeply oversold, Bitcoin Dominance is heavily overbought, altcoins have much more liquidity sitting above them than below, and all of these factors combined are building the picture that very soon it is likely to be the altcoin show.
XRP vs ETH
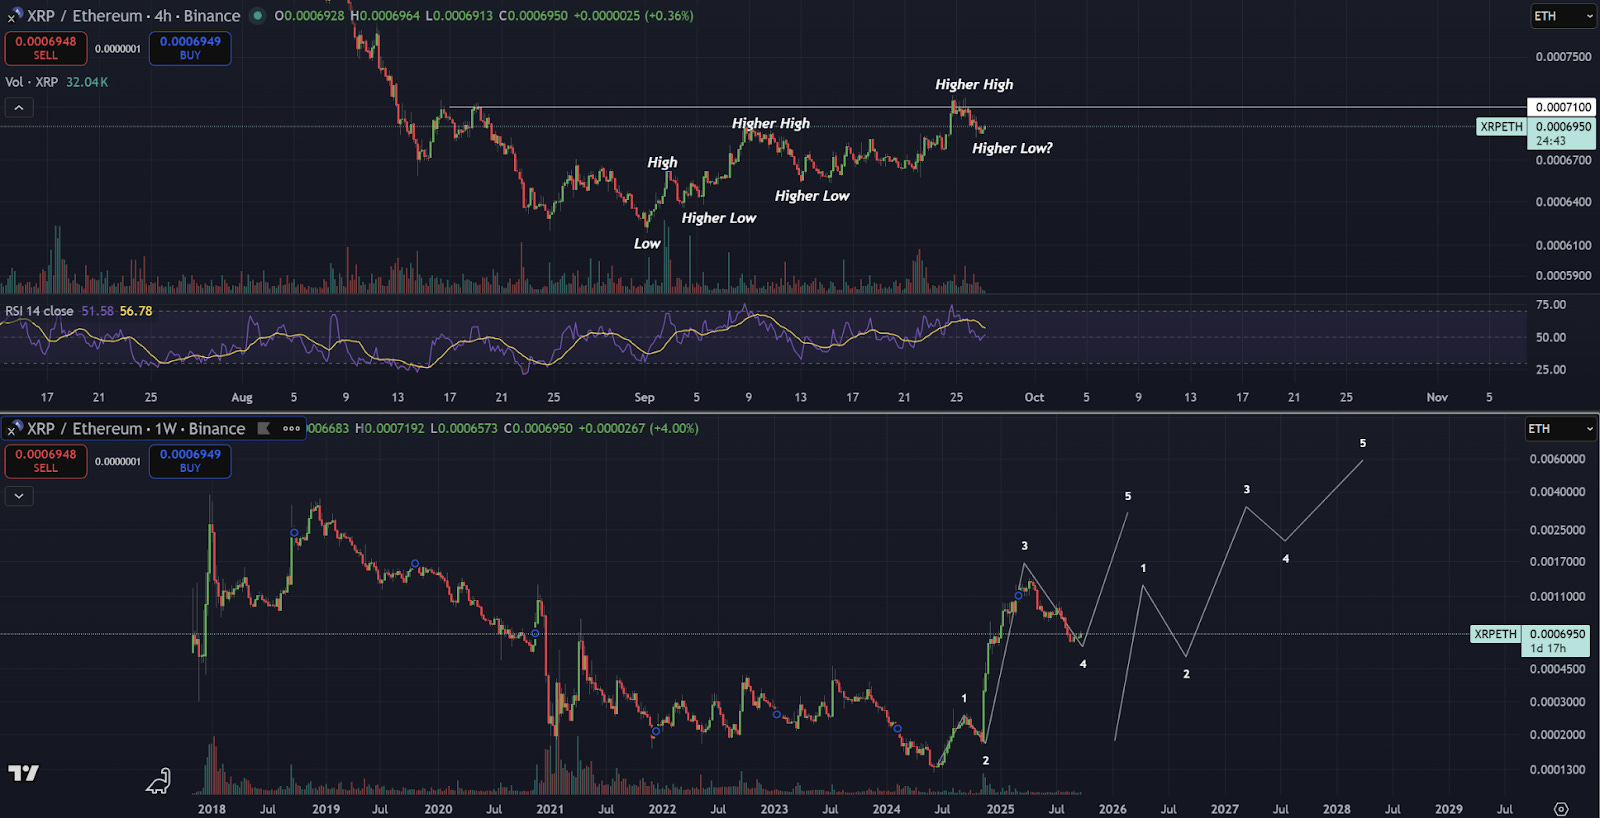
Finally, I know we have not touched much on XRP in this piece because my focus has been on painting the broader picture of altcoins and how the market feels toward them. But if we look at the chart above, what we can see is XRP against ETH.
I have been saying that ETH is oversold, that Bitcoin Dominance looks ready to move lower, and that ETH may soon outperform Bitcoin. But what I am adding here is that XRP looks set to outperform ETH again.
On the top chart, the 4-hour timeframe shows a series of lows, higher lows, and higher highs against ETH, potentially at a local bottom. We are looking for closes above the 0.00071 level, and the larger the timeframe of the close above that level, the greater the likelihood of reversal.
The second chart below shows XRP against ETH on the weekly timeframe, with two possible wave count structures using Elliott Wave Theory. The chart on the left is a conservative five-wave structure that could take us back to all-time highs or at least matching highs against ETH. The chart on the right suggests an alternative scenario that begins from the point where the candle structure changes, and it shows the potential for exponential growth against ETH this cycle.
So, what I am saying here is twofold. First, ETH looks poised to perform well, even though many people overlook this because we have already risen from $1,500 to $4,000 or $5,000. Second, XRP looks ready to outperform ETH on top of that. Use your imagination for what could happen if those two things play out together.
We have seen countless announcements this week related to Ripple and XRP. I cannot possibly fit them all into this newsletter or I would be writing for days, but I cover them in real time on X, so make sure to follow me there for the latest updates. I will add one more chart because I am also bullish on that asset, and then I will close this week’s publication.
Flare: A New Opportunity
This chart is Flare, or Flare Networks. On the weekly timeframe, Flare has shown significant green volume on almost every green candle we have seen so far. Green volume has nearly outweighed red volume, which tells us buyers clearly like this asset. If we can close around current levels or higher, we will also break out of a wedge pattern with a technical target around 14 cents. With Flare currently sitting at 2.5 cents, the technical setup alone is compelling.
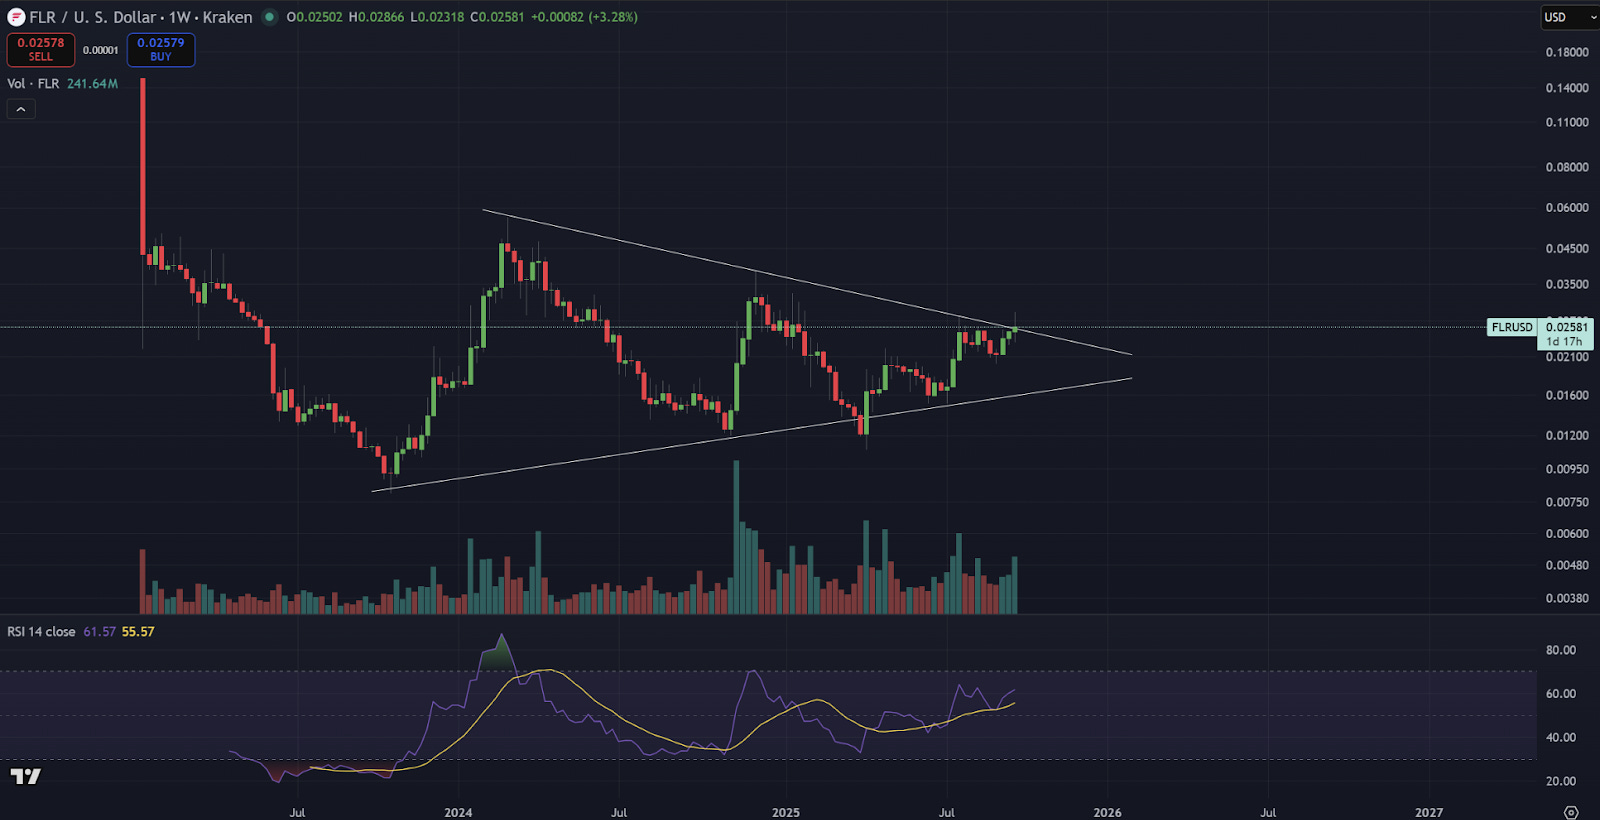
On the fundamental side, Flare has just launched the long-awaited F-assets. This finally gives the XRP community a direct way to participate in DeFi and earn native yield on their XRP. There is huge speculation about what this could mean for both institutional and retail demand. Hugo Fillion, Flare’s co-founder, has said he aims to capture five percent of the XRP supply by 2026. If that happens, and XRP holds its current value, Flare could 10x from here. If XRP itself appreciates, the effect would be multiplied even further.
Personally, I plan to participate heavily in the ecosystem. If Flare achieves even close to that level of traction, the opportunities within its ecosystem will be enormous. Applications launching on Flare are starting at zero market cap, and some of them could grow into billion-dollar protocols if adoption takes hold. That is where the exponential upside lies.
Of course, there will be risk. In every early ecosystem, some projects fail, break, or rug. That is simply part of the game. But the risk to reward here is exceptional. For once, the XRP community has a place to play, to earn yield, and potentially capture life-changing gains beyond the core XRP position.
I will leave you there for this week. I hope this encapsulates how I am thinking right now. Do not be frightened by pullbacks or by fearful narratives. People will capitulate along the way, but sticking to the plan is what pays. These are my thoughts, and I appreciate you taking the time to consider them.
📈 Charts Of The Week 📉
Written by @thecryptomann1 - X/Twitter
$BTC
I want to start off with some thoughts on $BTC. We’ve lost a range that, if I’m honest, I really didn’t want to see broken. It was a huge level of support, and we also dropped below the 100D EMA, which has consistently acted as strong support throughout this entire move up.
So what’s next? Now that this level has gone, I’m keeping a close eye on the liquidity around $105,000, which I’ve been talking about for the past few weeks. At this point, it looks increasingly likely we could tag it.
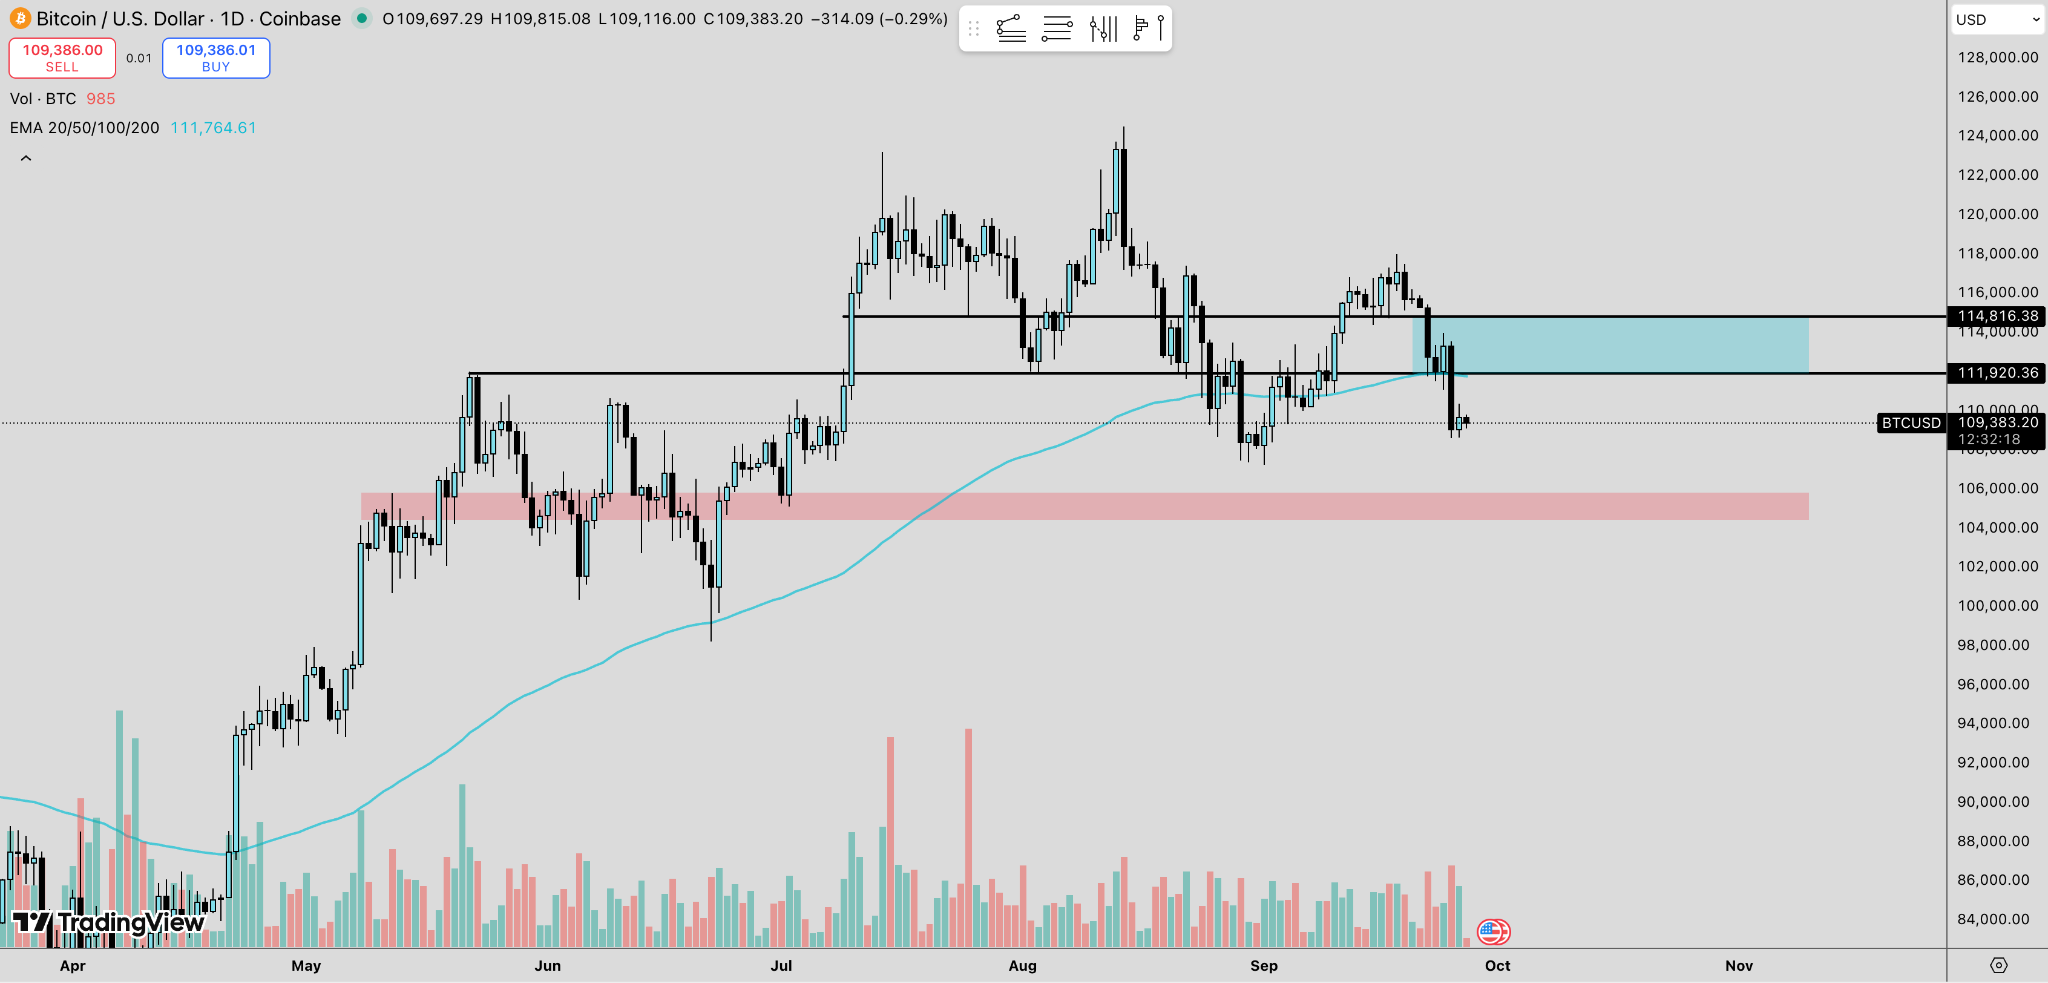
Structurally, it looks like $BTC could head lower in the short term. A thought I’ve been discussing with Will is that when the market reaches points like this, fear takes over, we lose crucial support levels, and everything starts to look grim. That’s usually when I sell, and then the market reverses.
This time I’m approaching it differently. I’m holding spot, so my view is that we could come down to $105,000 or even lower, but I’m not looking to short anything right now. I’ll just go long or add on areas where it makes sense from a risk to rewards point of view.
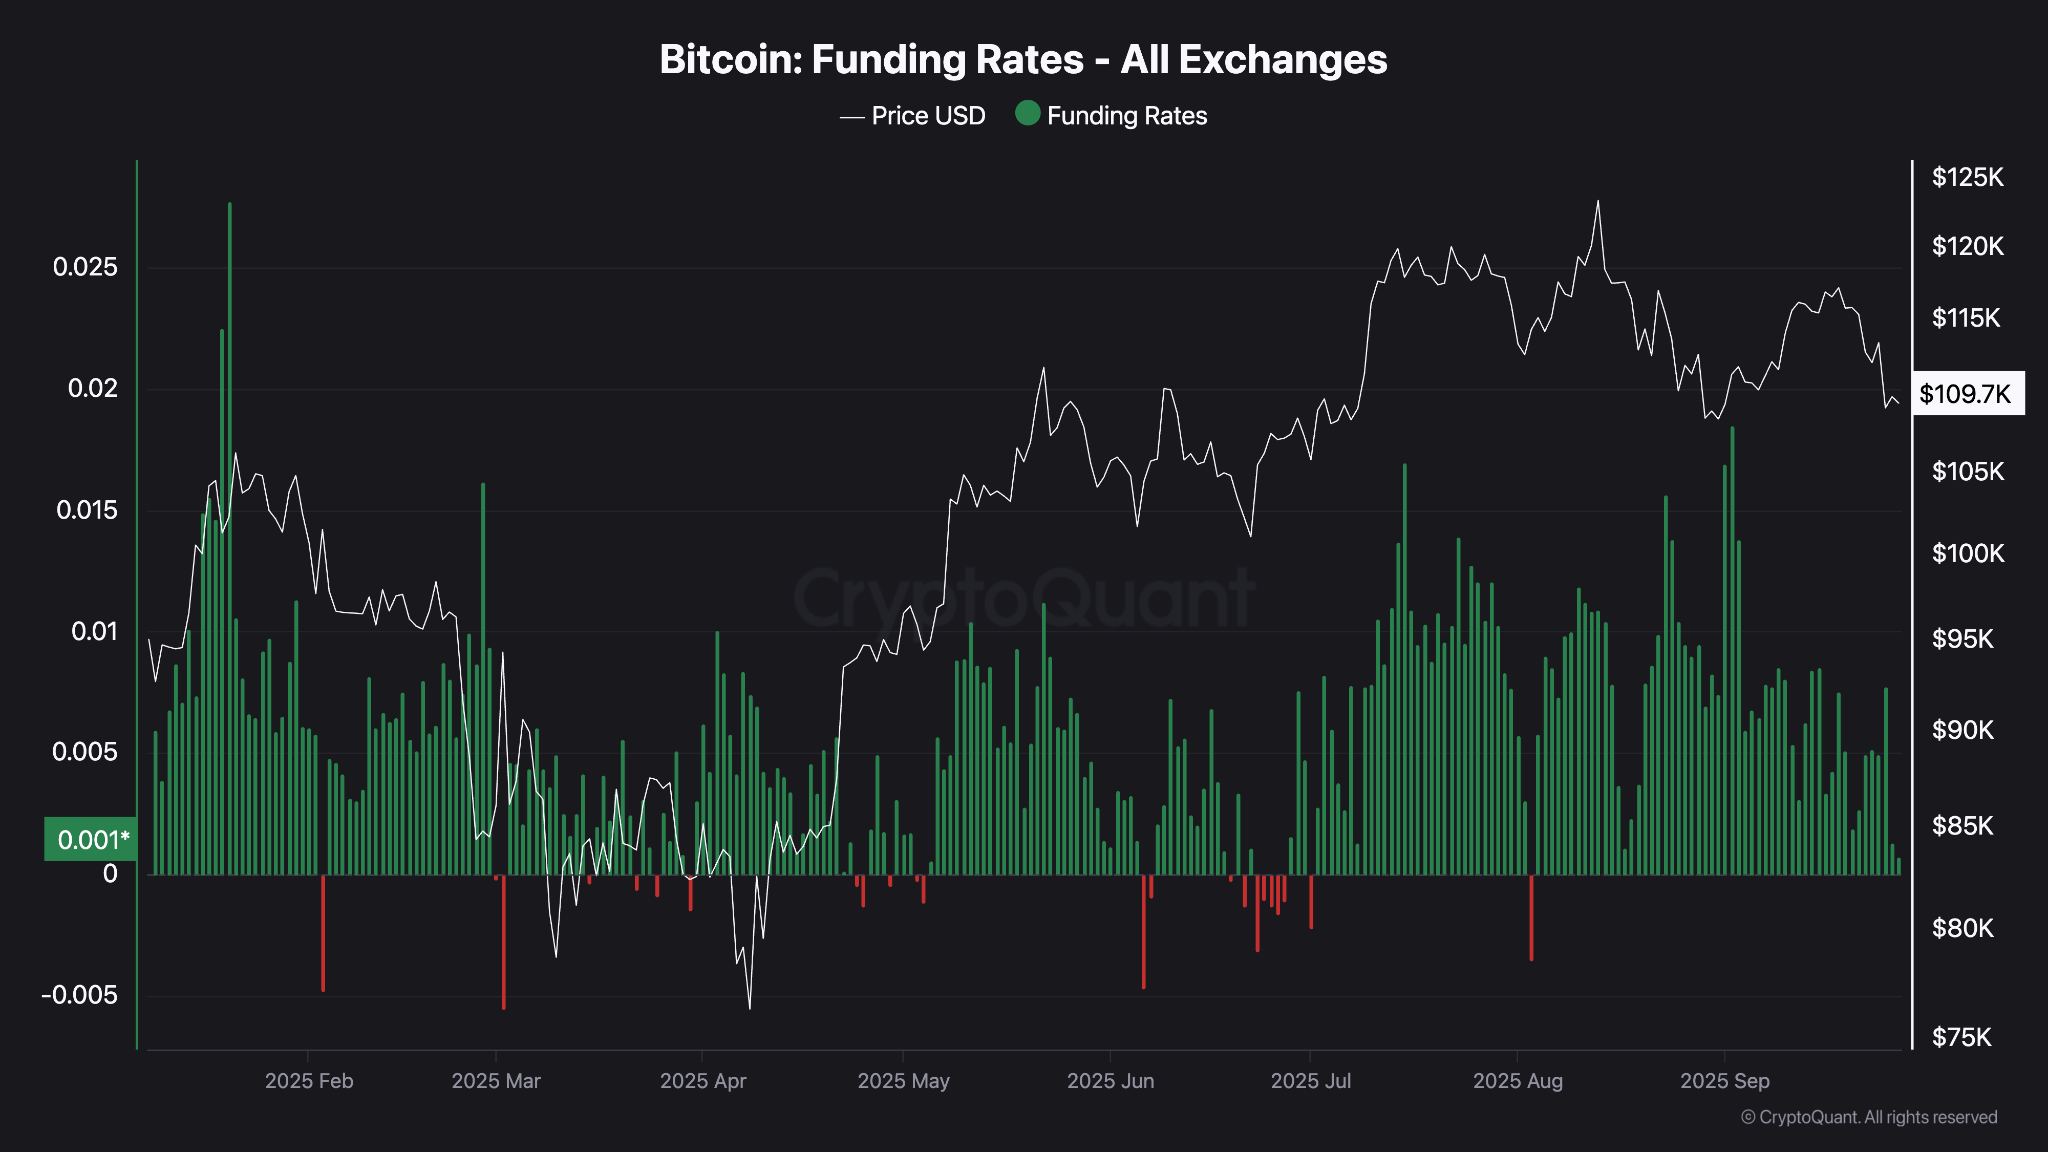
Another reason I’m still a bit skeptical, and why I think we could see another small push down, is funding rates. Looking at the chart below, we usually get a period of uncertainty where funding flips between negative and positive before $BTC properly reverses. We haven’t seen those negative funding rates come in yet.
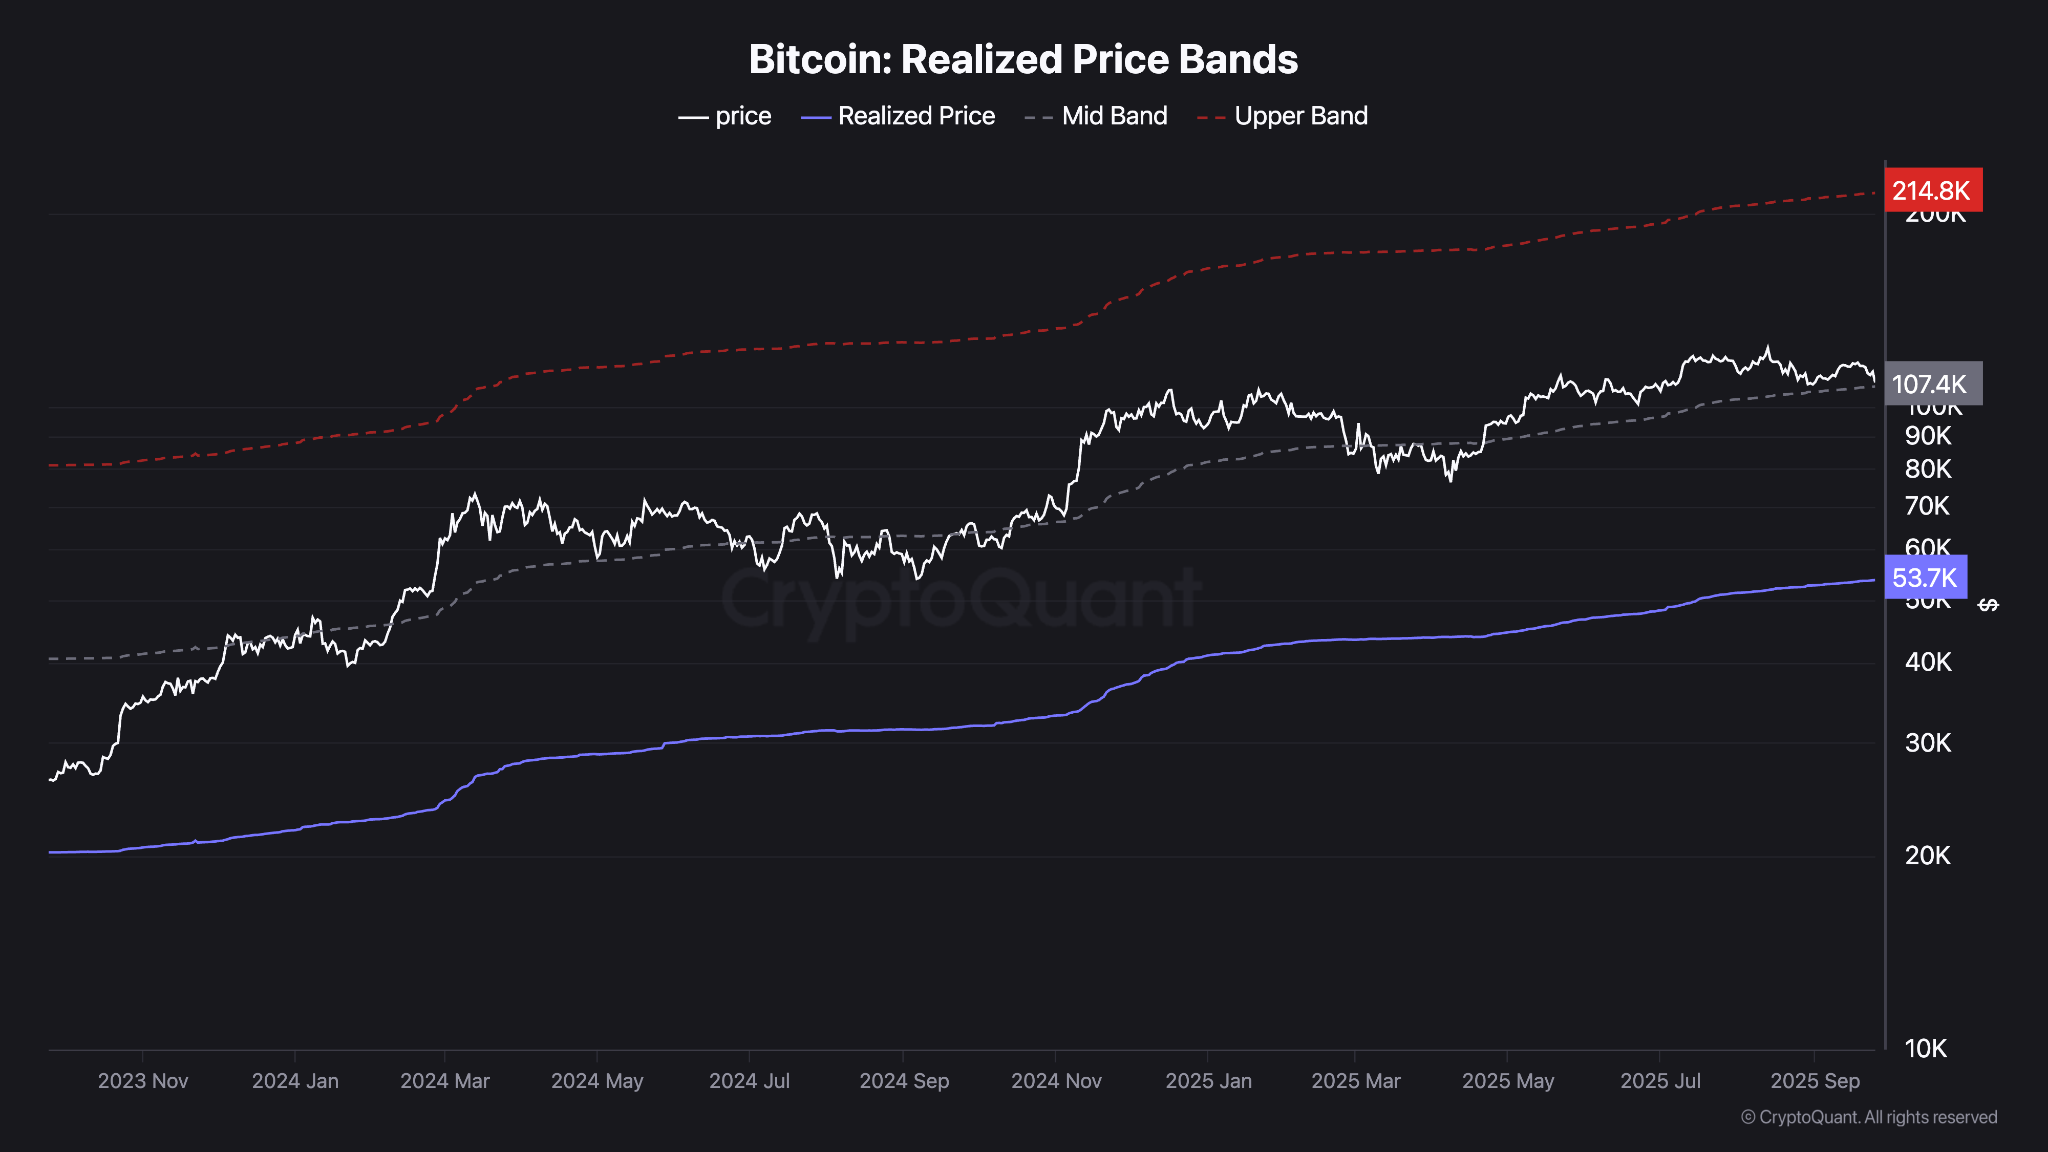
$BTC Realized Price
Ultimately, I’m still bullish. I don’t believe this is the cycle top. In my view, we are within 5 to 8 percent of finding a bottom from today’s price. We’re approaching the Realized Price mid band, currently around $106,000, which has historically acted as both support and resistance when looking at longer-term trends. For me, the approach is simple: HODL for now.
$CAKE
With everything happening around BNB Chain recently, I thought it made sense to revisit a chart I’ve been watching for a while, even though it hasn’t really moved yet. Structurally it looks strong, and the BNB Chain narrative adds weight to it. Despite the negative market conditions, it’s holding 50 on the RSI and sitting on the 100D EMA. I’d like to see more volume step in here, but I wanted to flag it again in case BNB assets rip on the next move up, which I think they will.
LINKS:
This newsletter is free because we love sharing our insights with the community. If you enjoy it and find value in our work, consider supporting Pav’s and Will’s Beer/Coffee Fund by donating $XRP to our newsletter donation wallet below. Cheers!
$XRP donation wallet: r3qf2nALyhFwC46QqZ5gJHpF3cjr5gRcoV
Trade XRP Memes here:
https://firstledger.net/?ref=6NRu4StwrImq
Trade on MEXC: https://www.mexc.com/register?inviteCode=mexc-1etb1
Trade on WEEX using this link: https://www.weex.com/login?from=https%3A%2F%2Fwww.weex.com%2FnewbieActivities%3Fid%3D520%26type%3DBEGINNER_TASK%26vipCode%3Duspf
Trading Different (Liquidity Map) - https://t.co/3ks3QMT5VJ?ssr=true
Really insightful read as ever. Just the tonic to remind myself to zoom out and look at the macro 👍
Love it boys nailed it once again 👌, itl be testing times ahead but that makes it all worth it ,